Marker Identification & Cluster Annotation Helpers
Compiled: May 11, 2026
Source:vignettes/articles/Markers_and_Cluster_Annotation.Rmd
Markers_and_Cluster_Annotation.RmdMarker Identification & Cluster Annotation
scCustomize has several helper functions to assist with identification of marker genes and annotation of clusters. Load packages & Data
# Load Packages
library(ggplot2)
library(dplyr)
library(magrittr)
library(Seurat)
library(scCustomize)
library(qs2)

# Load example dataset for tutorial
pbmc <- pbmc3k.SeuratData::pbmc3k.final
Helper functions available are:
-
Extract_Top_Markers(): Extract either a filtered data.frame or vector of gene IDs (with option to export named vector) containing top N markers from data.frame. -
Create_Cluster_Annotation_File(): Create simple csv file for use in annotating clusters. -
Pull_Cluster_Annotation(): Pull cluster annotation information quickly from data.frame/tibble or annotation csv file. -
Rename_Clusters(): Wrapper function to easily rename clusters.
We will use pbmc3K dataset from SeuratData package as example for this vignette.
Percent Difference in Expression
If we run FindAllMarkers() like normal, this is the
output.
# Run basic FindAllMarkers DE test
all_markers <- FindAllMarkers(object = pbmc, verbose = F)

all_markers <- all_markers %>%
    group_by(cluster) %>%
    arrange(desc(avg_log2FC)) %>%
arrange(cluster)| p_val | avg_log2FC | pct.1 | pct.2 | p_val_adj | cluster | gene | |
|---|---|---|---|---|---|---|---|
| 1 | 0.00e+00 | 7.115580 | 0.016 | 0.000 | 0.0004033 | Naive CD4 T | GTSCR1 |
| 2 | 0.00e+00 | 5.853999 | 0.022 | 0.001 | 0.0000122 | Naive CD4 T | REG4 |
| 3 | 0.00e+00 | 4.791871 | 0.034 | 0.003 | 0.0000001 | Naive CD4 T | NOG |
| 4 | 8.71e-05 | 4.425698 | 0.010 | 0.001 | 1.0000000 | Naive CD4 T | ST6GALNAC1 |
| 5 | 8.67e-05 | 4.423395 | 0.010 | 0.001 | 1.0000000 | Naive CD4 T | AXIN2 |
While Seurat::FindAllMarkers()returns the percent of
cells in identity 1 (pct.1) and identity 2 (pct.2) that express a marker
it can be helpful to view the difference in these two measures in
addition to the values alone.
scCustomize contains helper function: Add_Pct_Diff() to
add the percent difference between two clusters.
Add_Pct_Diff can be used with any output from Seurat,
SeuratWrappers, or other DE tests and can be piped with the function
itself.
Use Add_Pct_Diff piped with the marker function.
# run piped with Seurat command
all_markers_pct <- FindAllMarkers(object = pbmc, verbose = F) %>%
    Add_Pct_Diff()

all_markers_pct <- all_markers_pct %>%
    group_by(cluster) %>%
    arrange(desc(avg_log2FC)) %>%
arrange(cluster)| p_val | avg_log2FC | pct.1 | pct.2 | p_val_adj | cluster | gene | pct_diff | |
|---|---|---|---|---|---|---|---|---|
| 1 | 0.00e+00 | 7.115580 | 0.016 | 0.000 | 0.0004033 | Naive CD4 T | GTSCR1 | 0.016 |
| 2 | 0.00e+00 | 5.853999 | 0.022 | 0.001 | 0.0000122 | Naive CD4 T | REG4 | 0.021 |
| 3 | 0.00e+00 | 4.791871 | 0.034 | 0.003 | 0.0000001 | Naive CD4 T | NOG | 0.031 |
| 4 | 8.71e-05 | 4.425698 | 0.010 | 0.001 | 1.0000000 | Naive CD4 T | ST6GALNAC1 | 0.009 |
| 5 | 8.67e-05 | 4.423395 | 0.010 | 0.001 | 1.0000000 | Naive CD4 T | AXIN2 | 0.009 |
Use Add_Pct_Diff post-hoc
Add_Pct_Diff can also simply be run after generating
marker data.frame:
all_markers_pct <- Add_Pct_Diff(marker_dataframe = all_markers)Use with non-Seurat data.frames
Add_Pct_Diff can be used with any data.frame as long as
the column names that specify percent expressed in the 2 groups are
provided
all_markers_pct <- Add_Pct_Diff(marker_dataframe = all_markers, pct.1_name = "percent1", pct.2_name = "percent2")Extract the top N marker genes per cluster, identity, treatment etc
scCustomize contains function Extract_Top_Markers to get
the top N genes from each cluster (or other group of choice). It has the
option to return either a vector of genes or a filtered data.frame.
Returns a Named Vector (Default)
# By default it returns a named vector of genes (each gene named for cluster it was associated
# with)
top_5 <- Extract_Top_Markers(marker_dataframe = all_markers, num_features = 5, rank_by = "avg_log2FC")
head(top_5, 10)
## Naive CD4 T Naive CD4 T Naive CD4 T Naive CD4 T Naive CD4 T
## "GTSCR1" "REG4" "NOG" "ST6GALNAC1" "AXIN2"
## Memory CD4 T Memory CD4 T Memory CD4 T Memory CD4 T Memory CD4 T
## "HSD11B1" "RP11-90D4.3" "RFPL2" "CCL27" "CCR10"Return data.frame (Optional)
top_5_df <- Extract_Top_Markers(marker_dataframe = all_markers, num_features = 5, data_frame = TRUE,
    rank_by = "avg_log2FC")

head(top_5_df, 10)| p_val | avg_log2FC | pct.1 | pct.2 | p_val_adj | cluster | gene | |
|---|---|---|---|---|---|---|---|
| 1 | 0.00e+00 | 7.115580 | 0.016 | 0.000 | 0.0004033 | Naive CD4 T | GTSCR1 |
| 2 | 0.00e+00 | 5.853999 | 0.022 | 0.001 | 0.0000122 | Naive CD4 T | REG4 |
| 3 | 0.00e+00 | 4.791871 | 0.034 | 0.003 | 0.0000001 | Naive CD4 T | NOG |
| 4 | 8.71e-05 | 4.425698 | 0.010 | 0.001 | 1.0000000 | Naive CD4 T | ST6GALNAC1 |
| 5 | 8.67e-05 | 4.423395 | 0.010 | 0.001 | 1.0000000 | Naive CD4 T | AXIN2 |
| 2584 | 0.00e+00 | 7.049508 | 0.017 | 0.000 | 0.0000302 | Memory CD4 T | HSD11B1 |
| 2585 | 2.30e-06 | 6.574363 | 0.010 | 0.000 | 0.0313519 | Memory CD4 T | RP11-90D4.3 |
| 2586 | 3.30e-05 | 5.049954 | 0.012 | 0.001 | 0.4521838 | Memory CD4 T | RFPL2 |
| 2587 | 3.78e-05 | 4.002013 | 0.010 | 0.000 | 0.5180331 | Memory CD4 T | CCL27 |
| 2588 | 0.00e+00 | 3.725109 | 0.039 | 0.004 | 0.0000000 | Memory CD4 T | CCR10 |
Use with non-Seurat data.frames
Extract_Top_Markers uses the data.frame output of
Seurat::FindAllMarkers() by default but can be used with
any data.frame by supplying few extra parameters. Let’s use the function
on the output from presto package and
order the results by auc instead of log2FC.
# Read in pre-computed data.frame results
presto_markers <- qs_read("assets/presto_markers.qs2")

# Extract top markers
top_5_presto <- Extract_Top_Markers(marker_dataframe = presto_markers, num_features = 5, group.by = "cluster",
    rank_by = "auc", gene_column = "gene")
head(top_5_presto, 10)
## Naive CD4 T Naive CD4 T Naive CD4 T Naive CD4 T Naive CD4 T Memory CD4 T
## "RPS12" "RPS27" "RPS6" "RPL32" "RPS14" "LTB"
## Memory CD4 T Memory CD4 T Memory CD4 T Memory CD4 T
## "IL32" "LDHB" "CD3D" "IL7R"Unique Vectors
When returning an unnamed vector you may want to return a unique list
without any duplicate features. This is often true when supplying a list
of features to plotting function like DoHeatmap() or
Cluster_DotPlot(). You can do this by setting parameter
make_unique = TRUE.
# Default parameters
top_5 <- Extract_Top_Markers(marker_dataframe = all_markers, num_features = 5, rank_by = "avg_log2FC",
    named_vector = FALSE)

any(duplicated(x = top_5))
## [1] FALSE
# Set `make_unique = TRUE`
top_5_unique <- Extract_Top_Markers(marker_dataframe = all_markers, num_features = 5, rank_by = "avg_log2FC",
    named_vector = FALSE, make_unique = TRUE)

any(duplicated(x = top_5_unique))
## [1] FALSEPairing Extract_Top_Markers with
Iterate_FeaturePlot_scCustom()
The advantage of exporting a named vector from
Extract_Top_Markers is that
Iterate_FeaturePlot_scCustom can detect the names and
either add those to the title of the plot (if
single_pdf = TRUE) or the file names if
FALSE.
Iterate_FeaturePlot_scCustom(seurat_object = pbmc, gene_list = top_5_presto, single_pdf = T)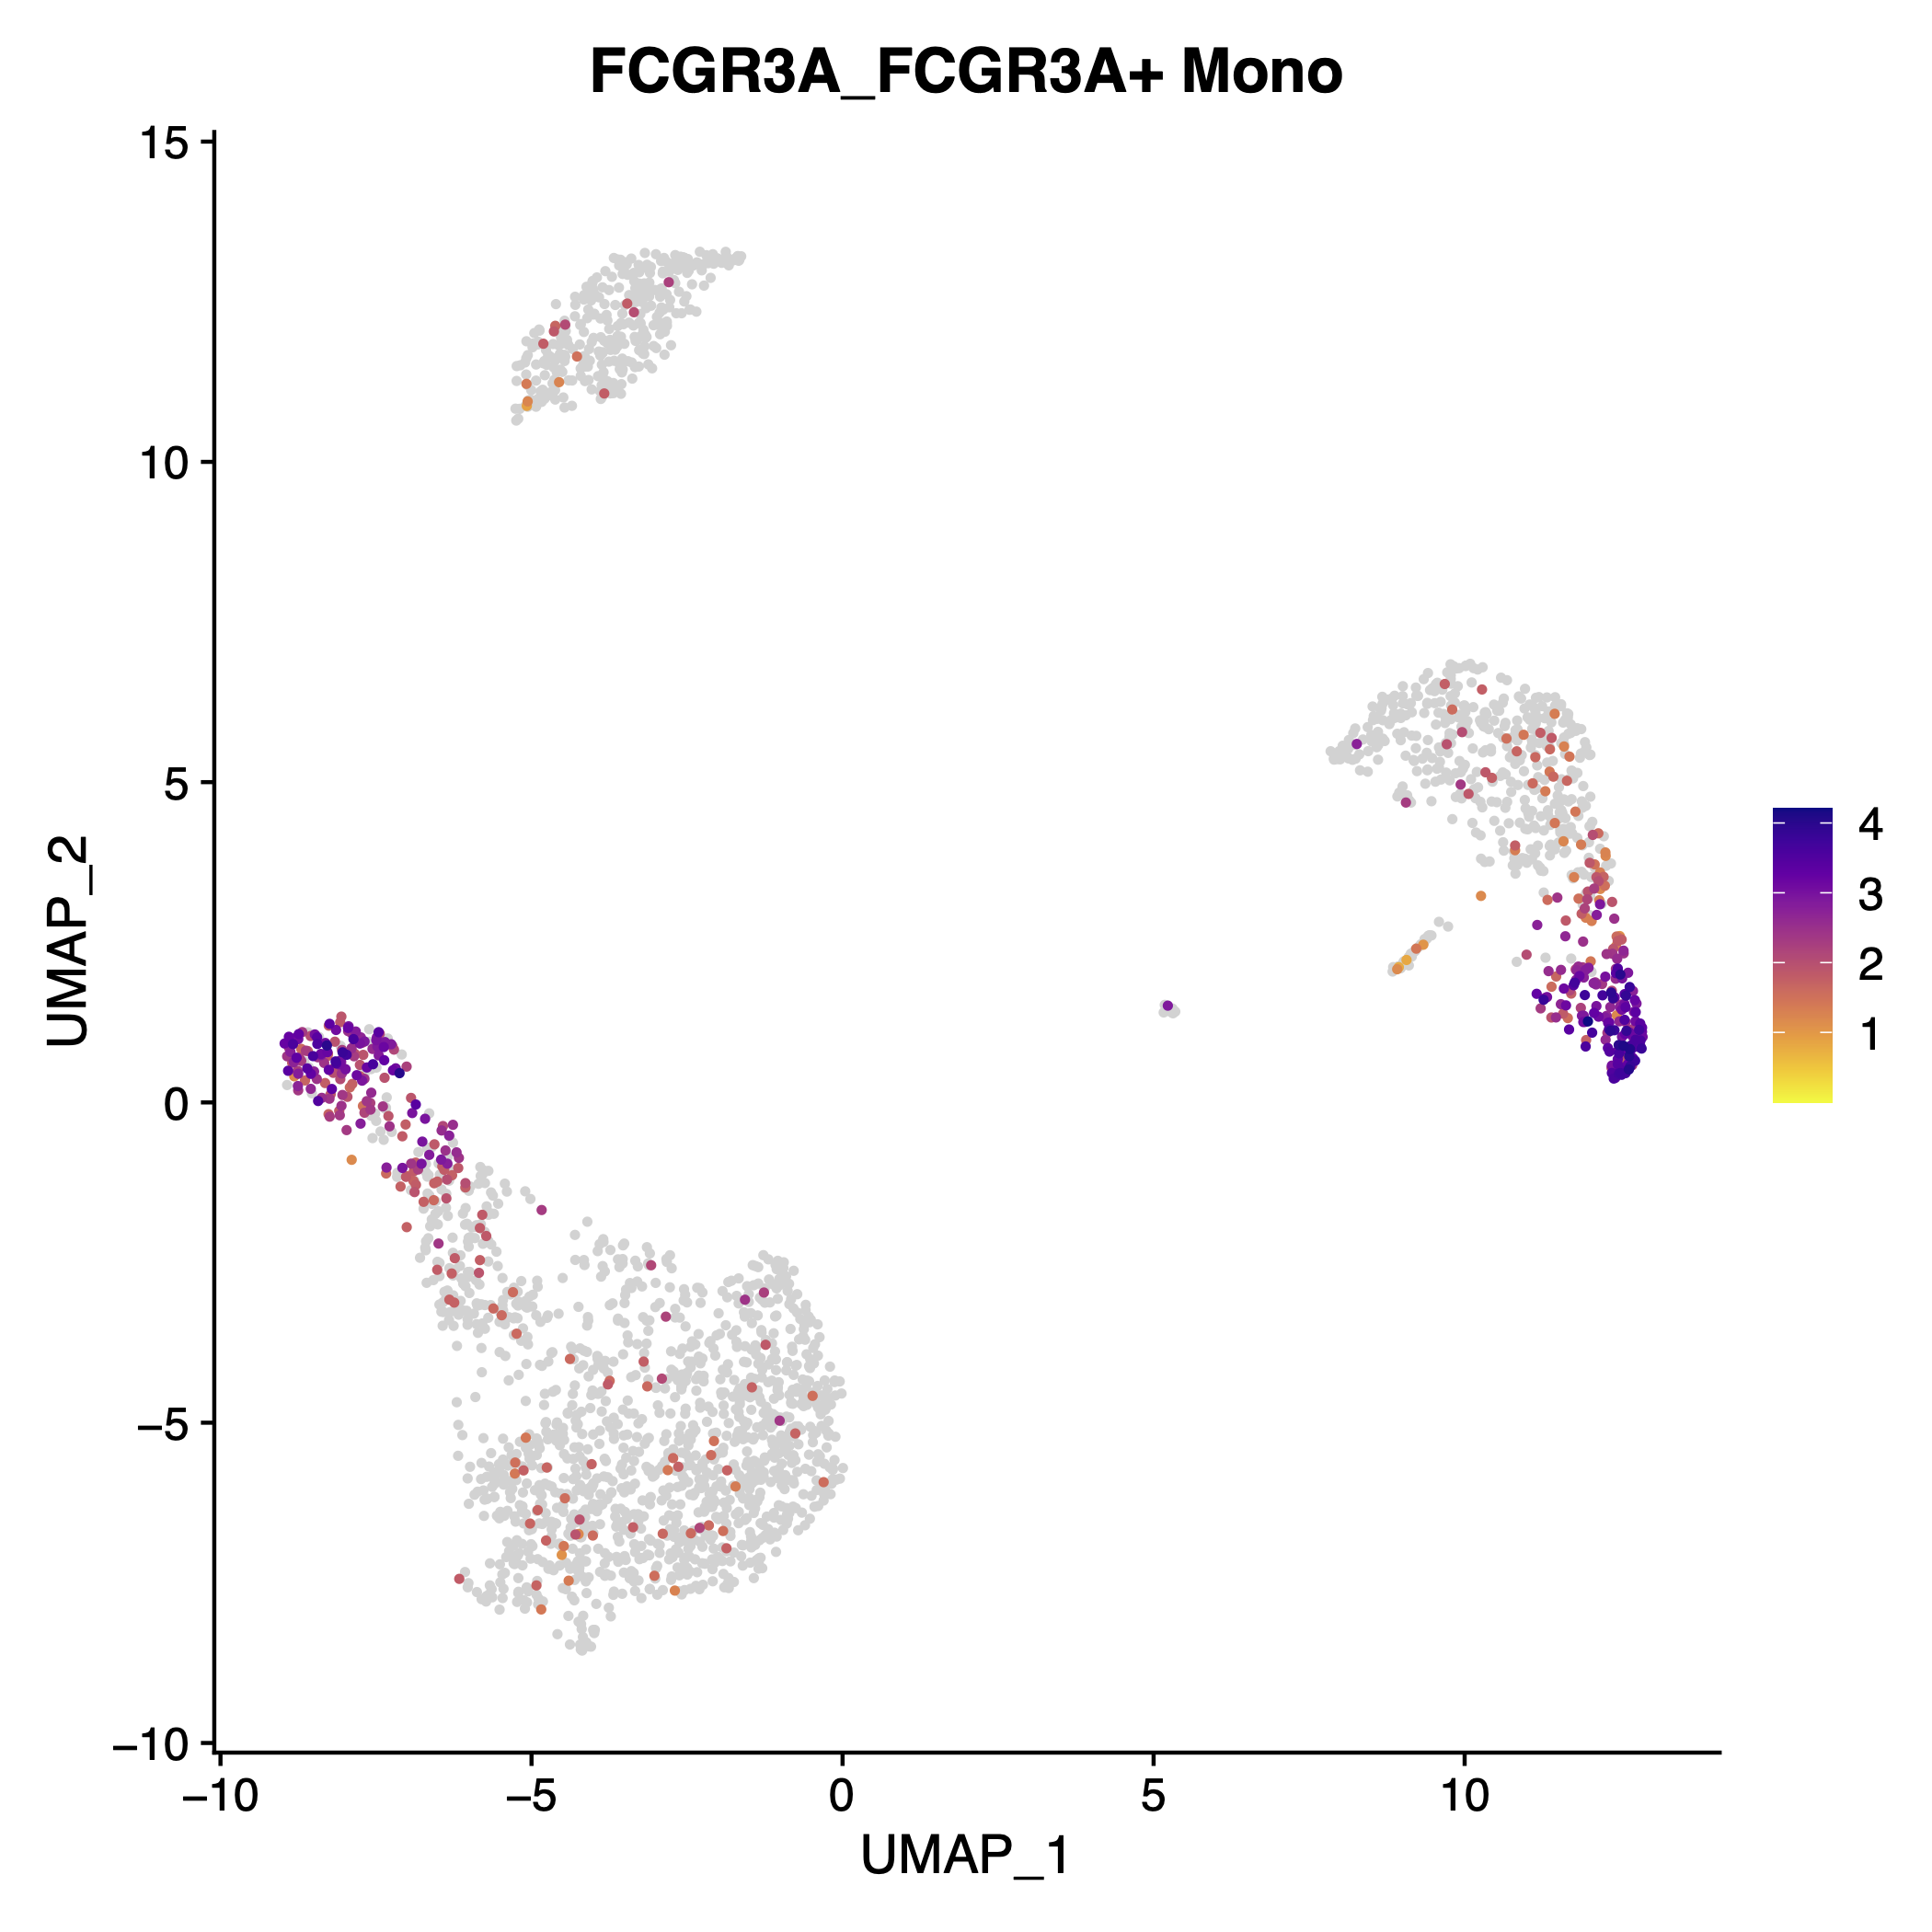
Create simple annotation files
Now for a simple helper we can use
Create_Cluster_Annotation_File to create simple csv file to
use for annotation.
Create_Cluster_Annotation_File(file_path = "data/", file_name = "ExpXX_Round01_Annotation")Here is an example that has already been filled out (using Excel, Numbers, or other editor program).
| cluster | cell_type | sub_type | notes | |
|---|---|---|---|---|
| 1 | 0 | oligo | Olig2+ | |
| 2 | 1 | micro | Proliferating | |
| 3 | 2 | micro | ||
| 4 | 3 | oligo | Newly formed | |
| 5 | 4 | oligo |
Extract annotation information
There is also complementary function to pull information back out of the this (or other) csv files or data.frames regarding clustering annotation.
annotation_info <- Pull_Cluster_Annotation(annotation = "assets/ExpXX_Round01_Annotation_Completed.csv")By default the function expects data.frame or file in same format as
Create_Cluster_Annotation_File but has optional parameters
that can be adjusted to file/data.frame with different column headers
(see cluster_name_col and cell_type_col).
Pull_Cluster_Annotation results
The result of Pull_Cluster_Annotation is a list that
contains:
- One entry for each unique cell type. The entry is named for the cell type and is a vector of the numbered clustered that correspond to that cell type.
- One entry called “new_cluster_idents” containing a vector of idents
in order that can be used for renaming clusters either using
Rename_Clustersfunction (see below) or manually. - One entry containing vector of cell sub-types (if present).
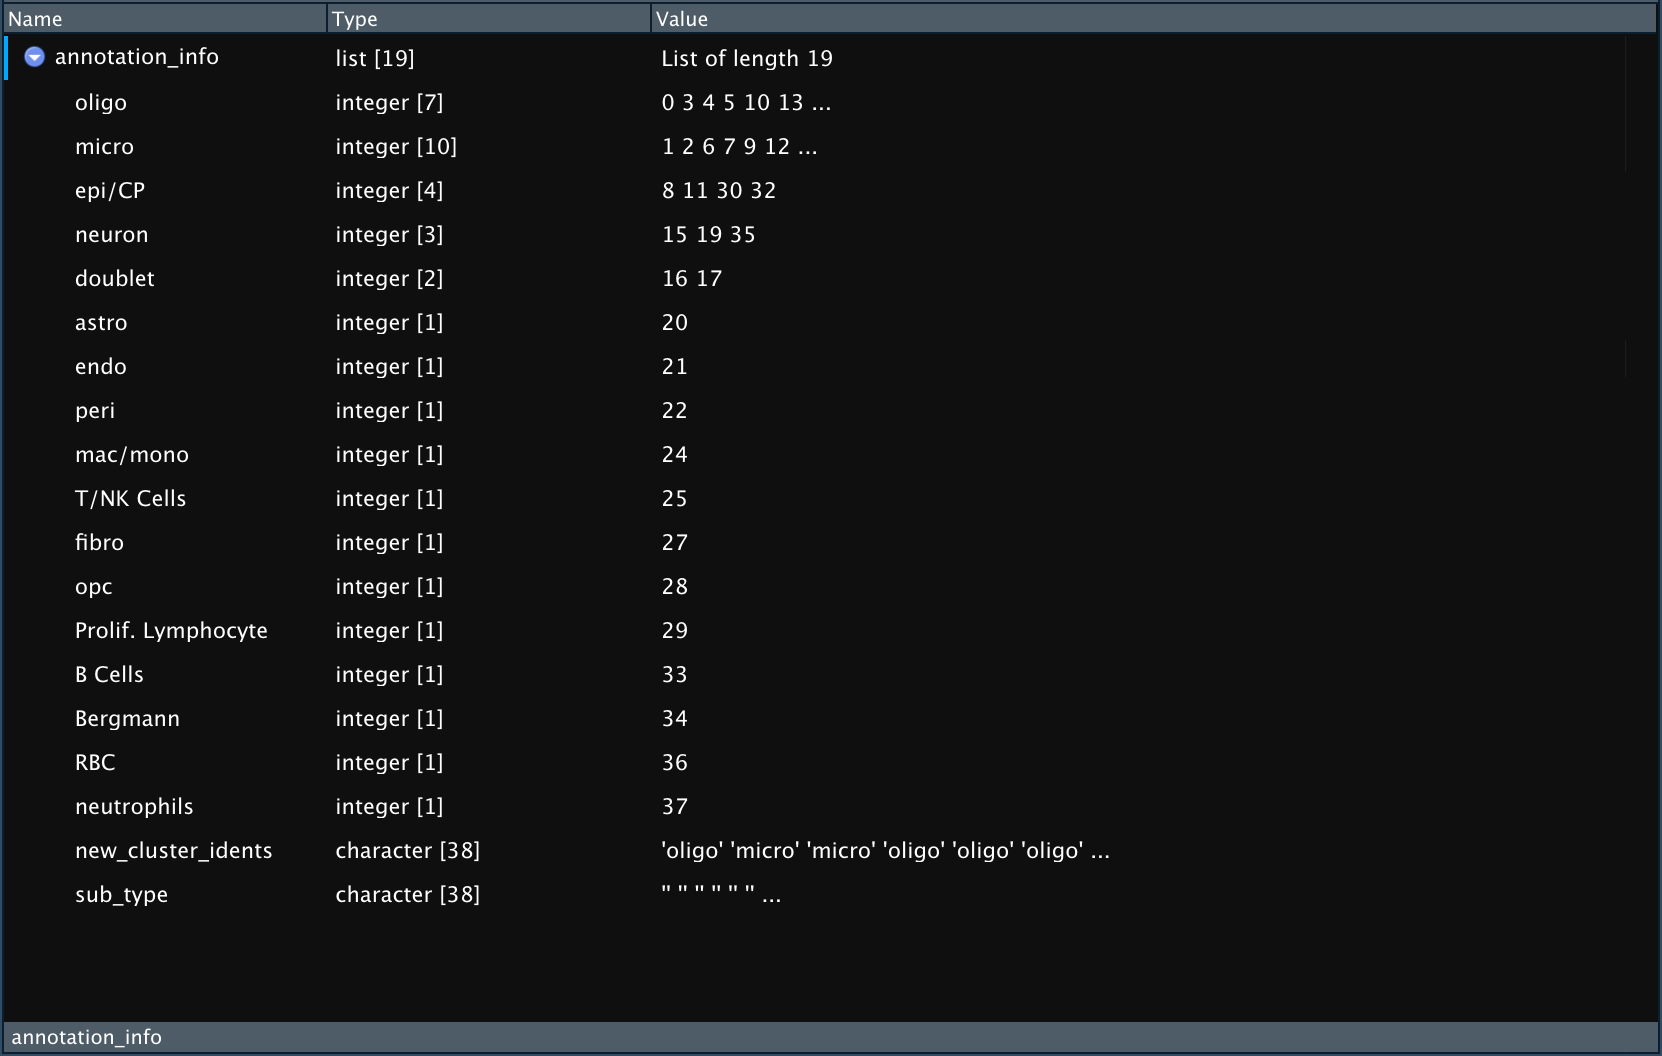 Example
output of `Pull_Cluster_Annotation
Example
output of `Pull_Cluster_Annotation
Renaming Clusters
Finally can use Rename_Clusters to easily rename and set
active.ident in Seurat Object. This is simple wrapper around Seurat
commands but adds additional checks/warnings and is simple
one-liner.
obj_renamed <- Rename_Clusters(seurat_object = obj, new_idents = annotation_info$new_cluster_idents)Rename_Clusters can take input from either
Pull_Cluster_Annotation “new_cluster_idents” or any
correctly ordered vector of new idents.
- If vector is not yet named (with the current levels of the Seurat
Object) then
Rename_Clusterswill perform that step. If already named this step will be omitted. -
Rename_Clusterscontains optional parameter to create new column in meta.data slot to store the old idents. Simply supply desired meta.data column name tometa_col_nameparameter.