Customized Color Palettes & Themes
Compiled: May 11, 2026
Source:vignettes/articles/Color_Palettes.Rmd
Color_Palettes.RmdChoosing Color Palettes and Themes
While the default Seurat and ggplot2 plots work well they can often be enhanced by customizing color palettes and themeing options used. To simplify/streamline this process for end users scCustomize:
1. Sets default discrete and continuous variables that are
consistent across the package and are customized to plotting
conditions.
2. Contains a number of shortcuts or helper functions for quick
access to color palettes and themes that are frequently
used.
Package Default Palettes
Plotting Continuous Variables
The continuous palettes from the viridis package improve plot readability and are more colorblind friendly than some commonly used continuous palettes. When plotting continuous variables (e.g., gene expression) scCustomize uses the reverse “plasma” palette by default.

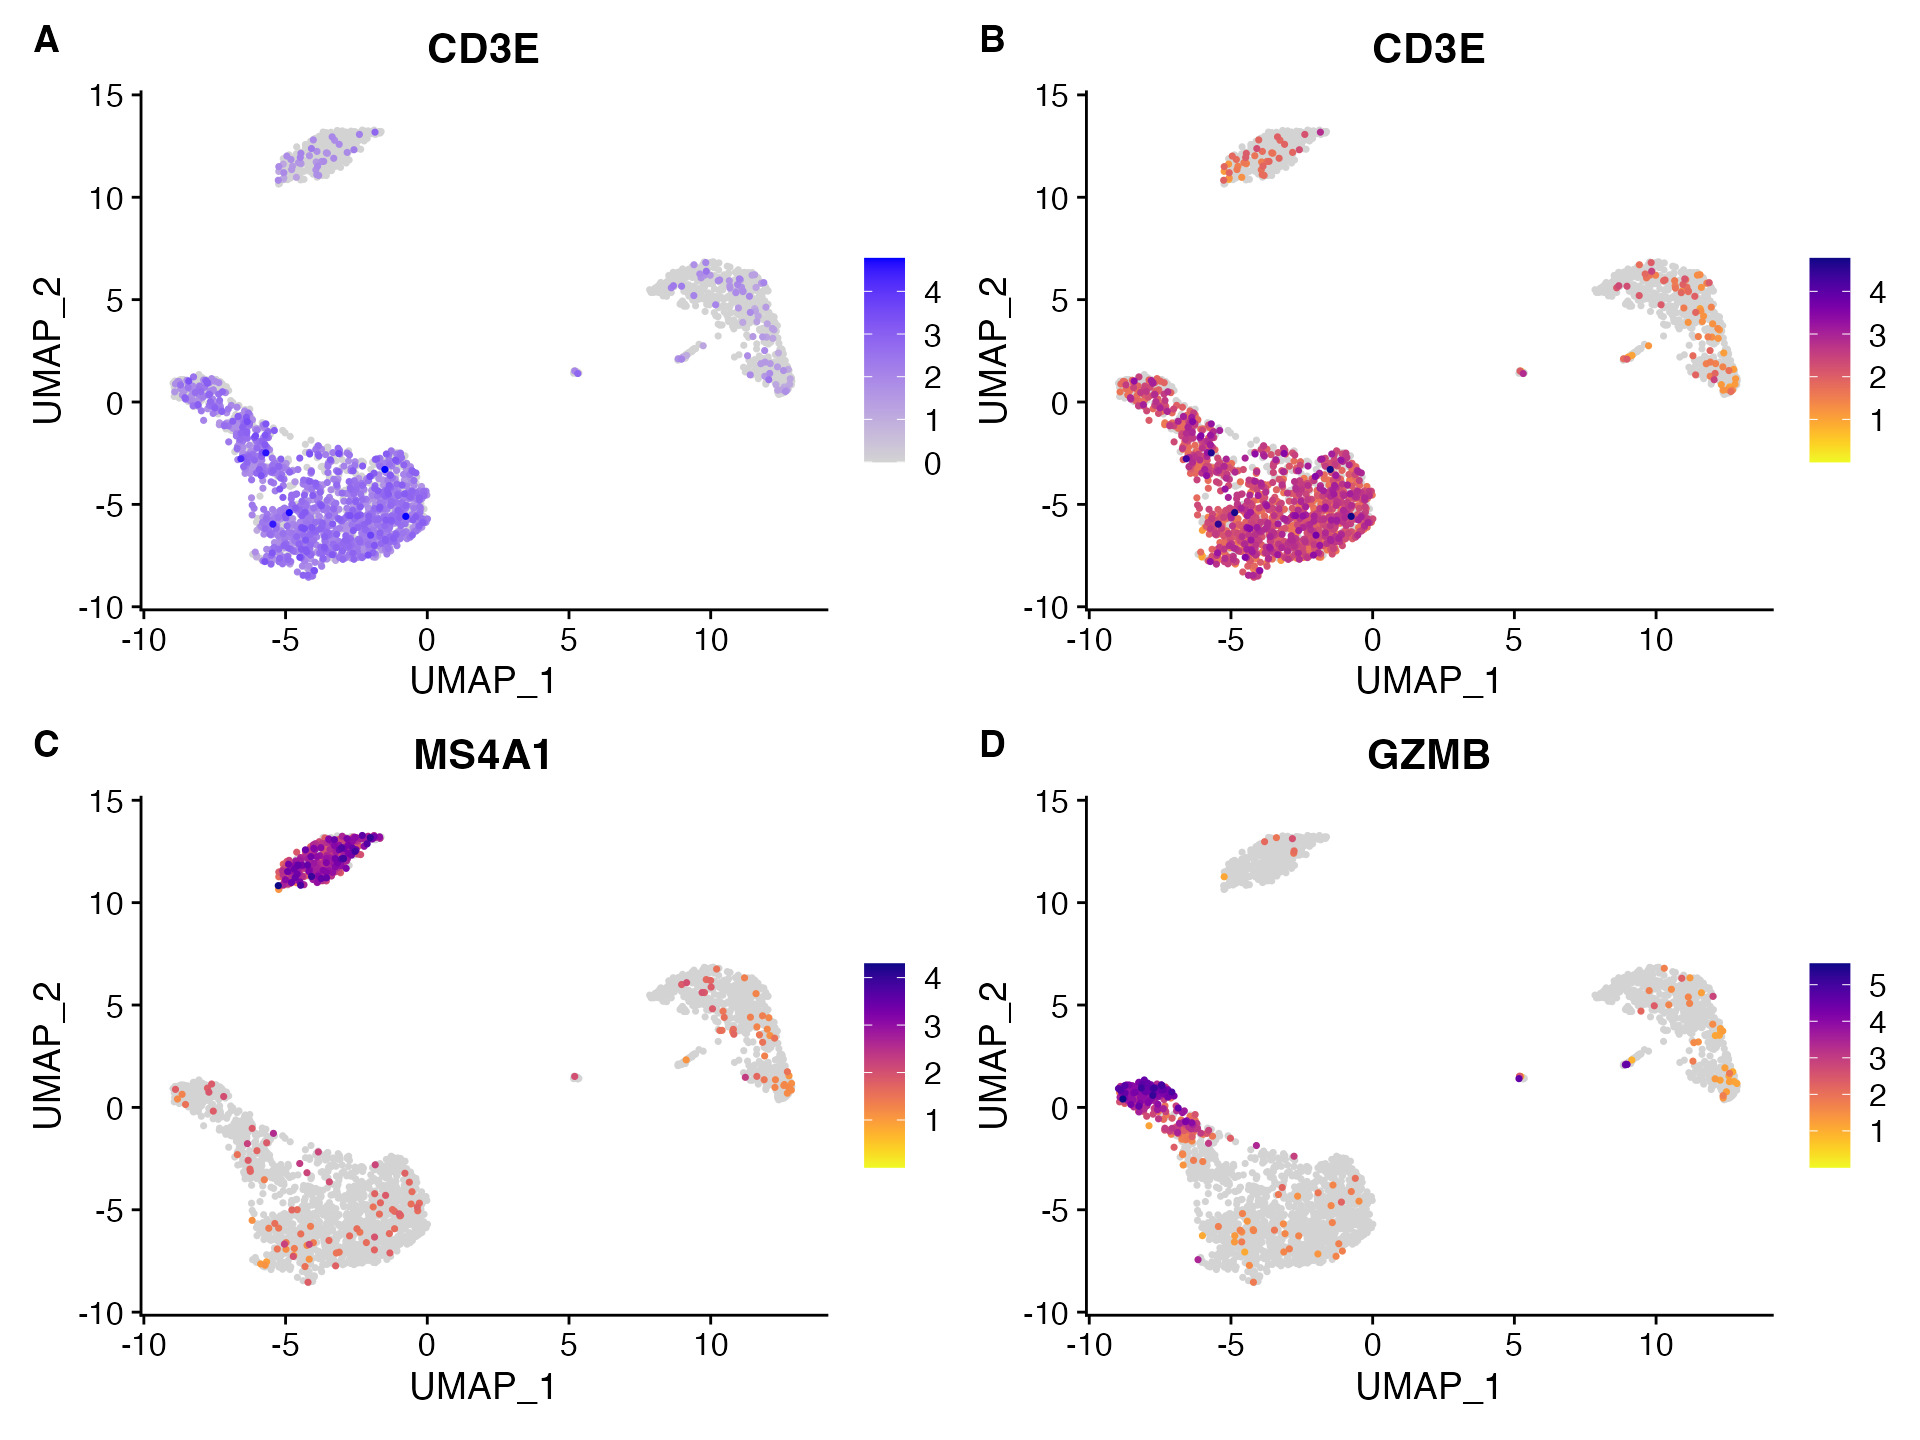
These palettes provided better contrast for continuous palettes. In
scCustomize the default is viridis_plasma_dark_high
There is one exception to this in that
Plot_Density_Custom() and Plot_Density_Joint()
use the “magma” palette by default. This choice was made as I believe
that the magma palette provides better color scale for these plots.
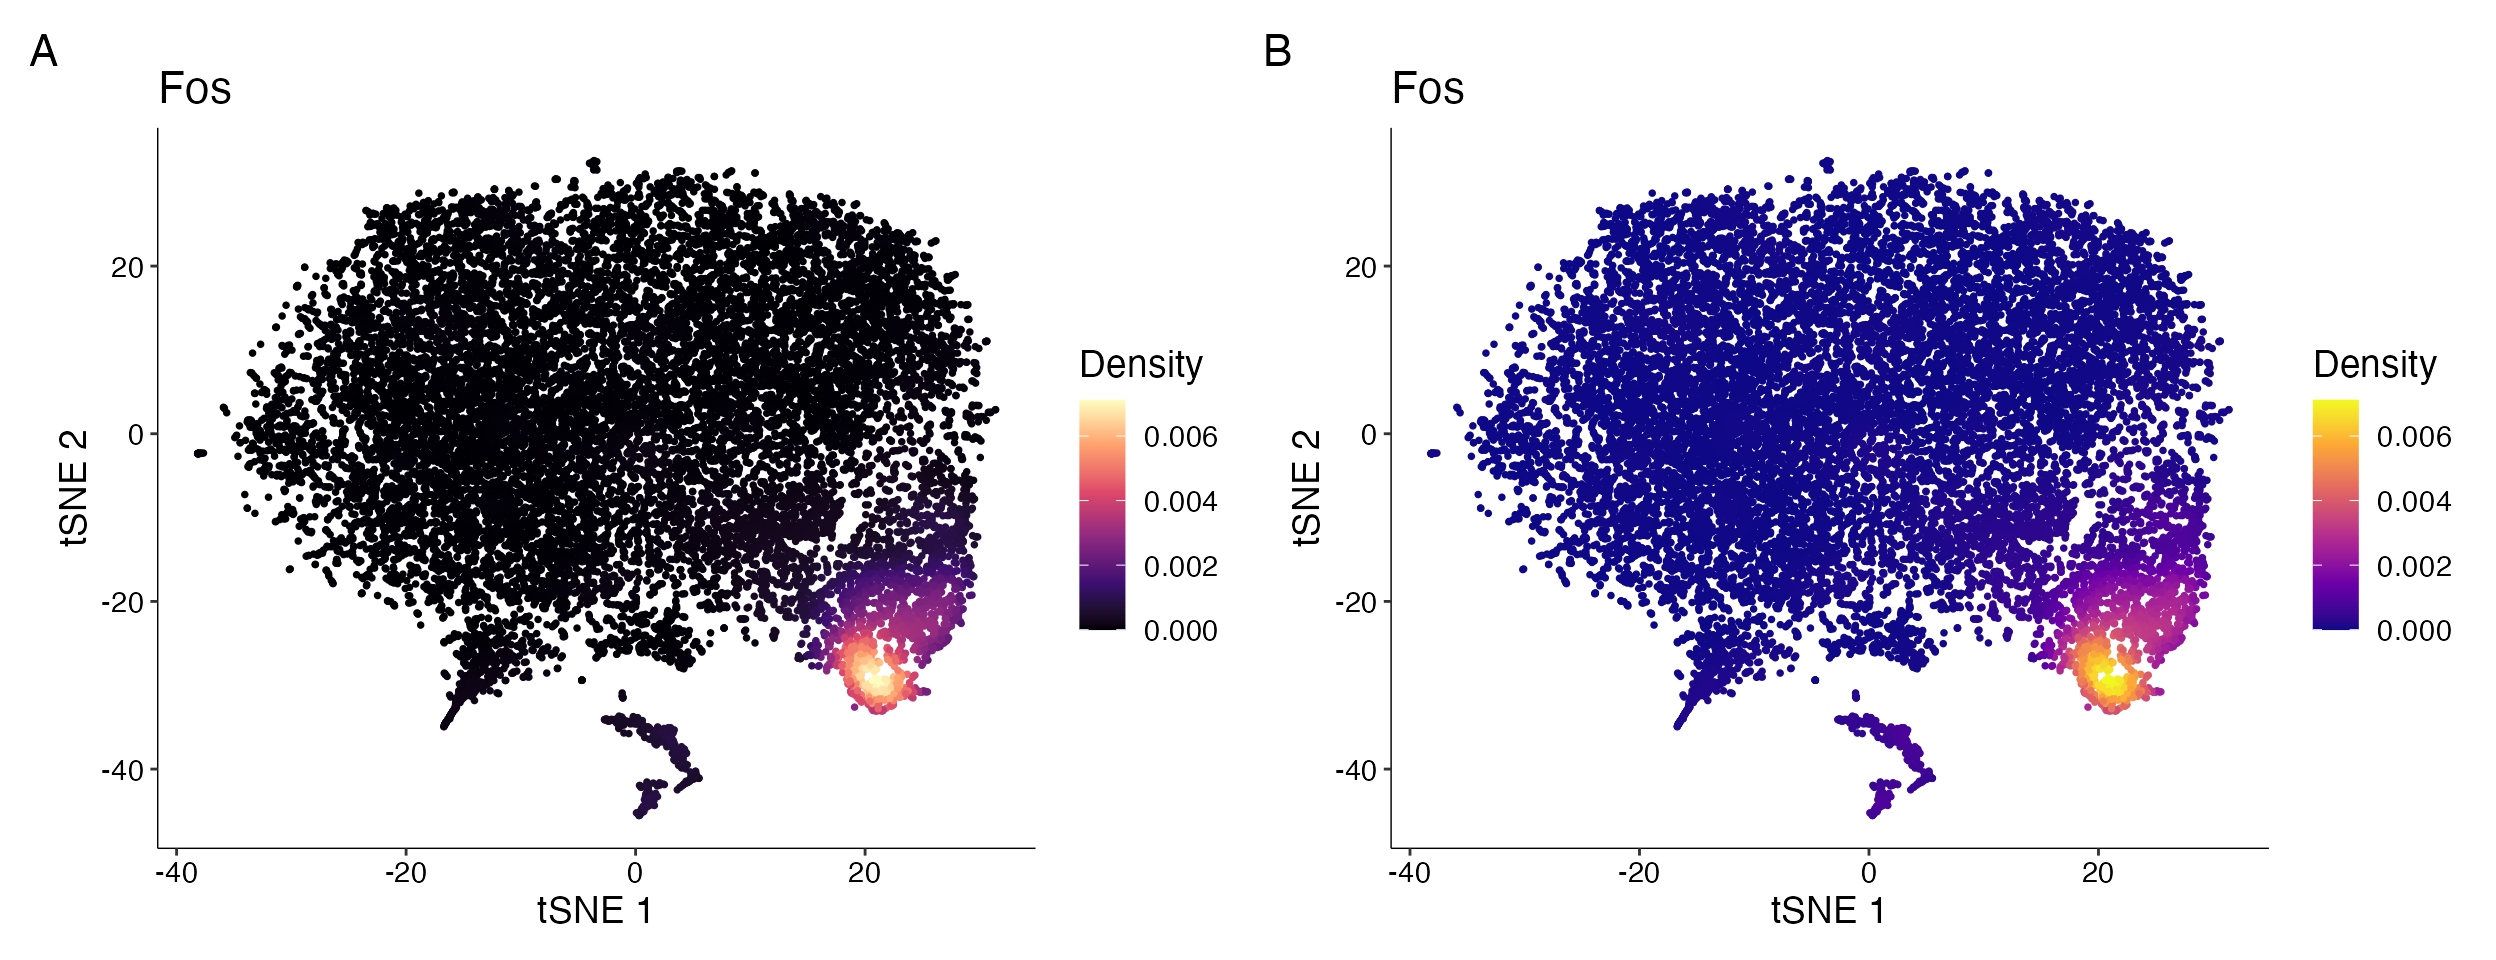
Example comparing A. default
Plot_Density_Custom which uses ‘magma’ palette
vs. B. plot using the ‘plasma’ palette.
Plotting Discrete Variables
To provide better visualizations using default parameters scCustomize
sets a series of defaults for plots with discrete palettes using
scCustomize_Palette() function.
- If only one identity is being plotted will use: “dodgerblue”.
- If only two identities are being plotted will use:
NavyAndOrange() - If between 2 and 8 identities are being plotted will use
ColorBlind_Pal. - If greater than 2 identities but less than or equal to 36 will use:
DiscretePalette_scCustomize(num_colors = 36, palette = "polychrome") - If greater than 36 identities will use dynamic varibow palette:
DiscretePalette_scCustomize(num_colors = *Number of identities*, palette = "varibow", shuffle_pal = TRUE)


Continuous Palettes
scCustomize has a number of quick helpers for access to palettes from viridis package. For more information on viridis palettes. These can be supplied to any appropriate plotting function in scCustomize or any other plot in R.
- viridis_plasma_dark_high
- viridis_plasma_light_high
- viridis_magma_dark_high
- viridis_magma_light_high
- viridis_inferno_dark_high
- viridis_inferno_light_high
- viridis_dark_high
- viridis_light_high
p1 <- FeaturePlot_scCustom(seurat_object = pbmc, features = "CD3E")
p2 <- FeaturePlot_scCustom(seurat_object = pbmc, colors_use = viridis_magma_dark_high, features = "CD3E")
p3 <- FeaturePlot_scCustom(seurat_object = pbmc, colors_use = viridis_inferno_dark_high, features = "CD3E")
p4 <- FeaturePlot_scCustom(seurat_object = pbmc, colors_use = viridis_light_high, features = "CD3E")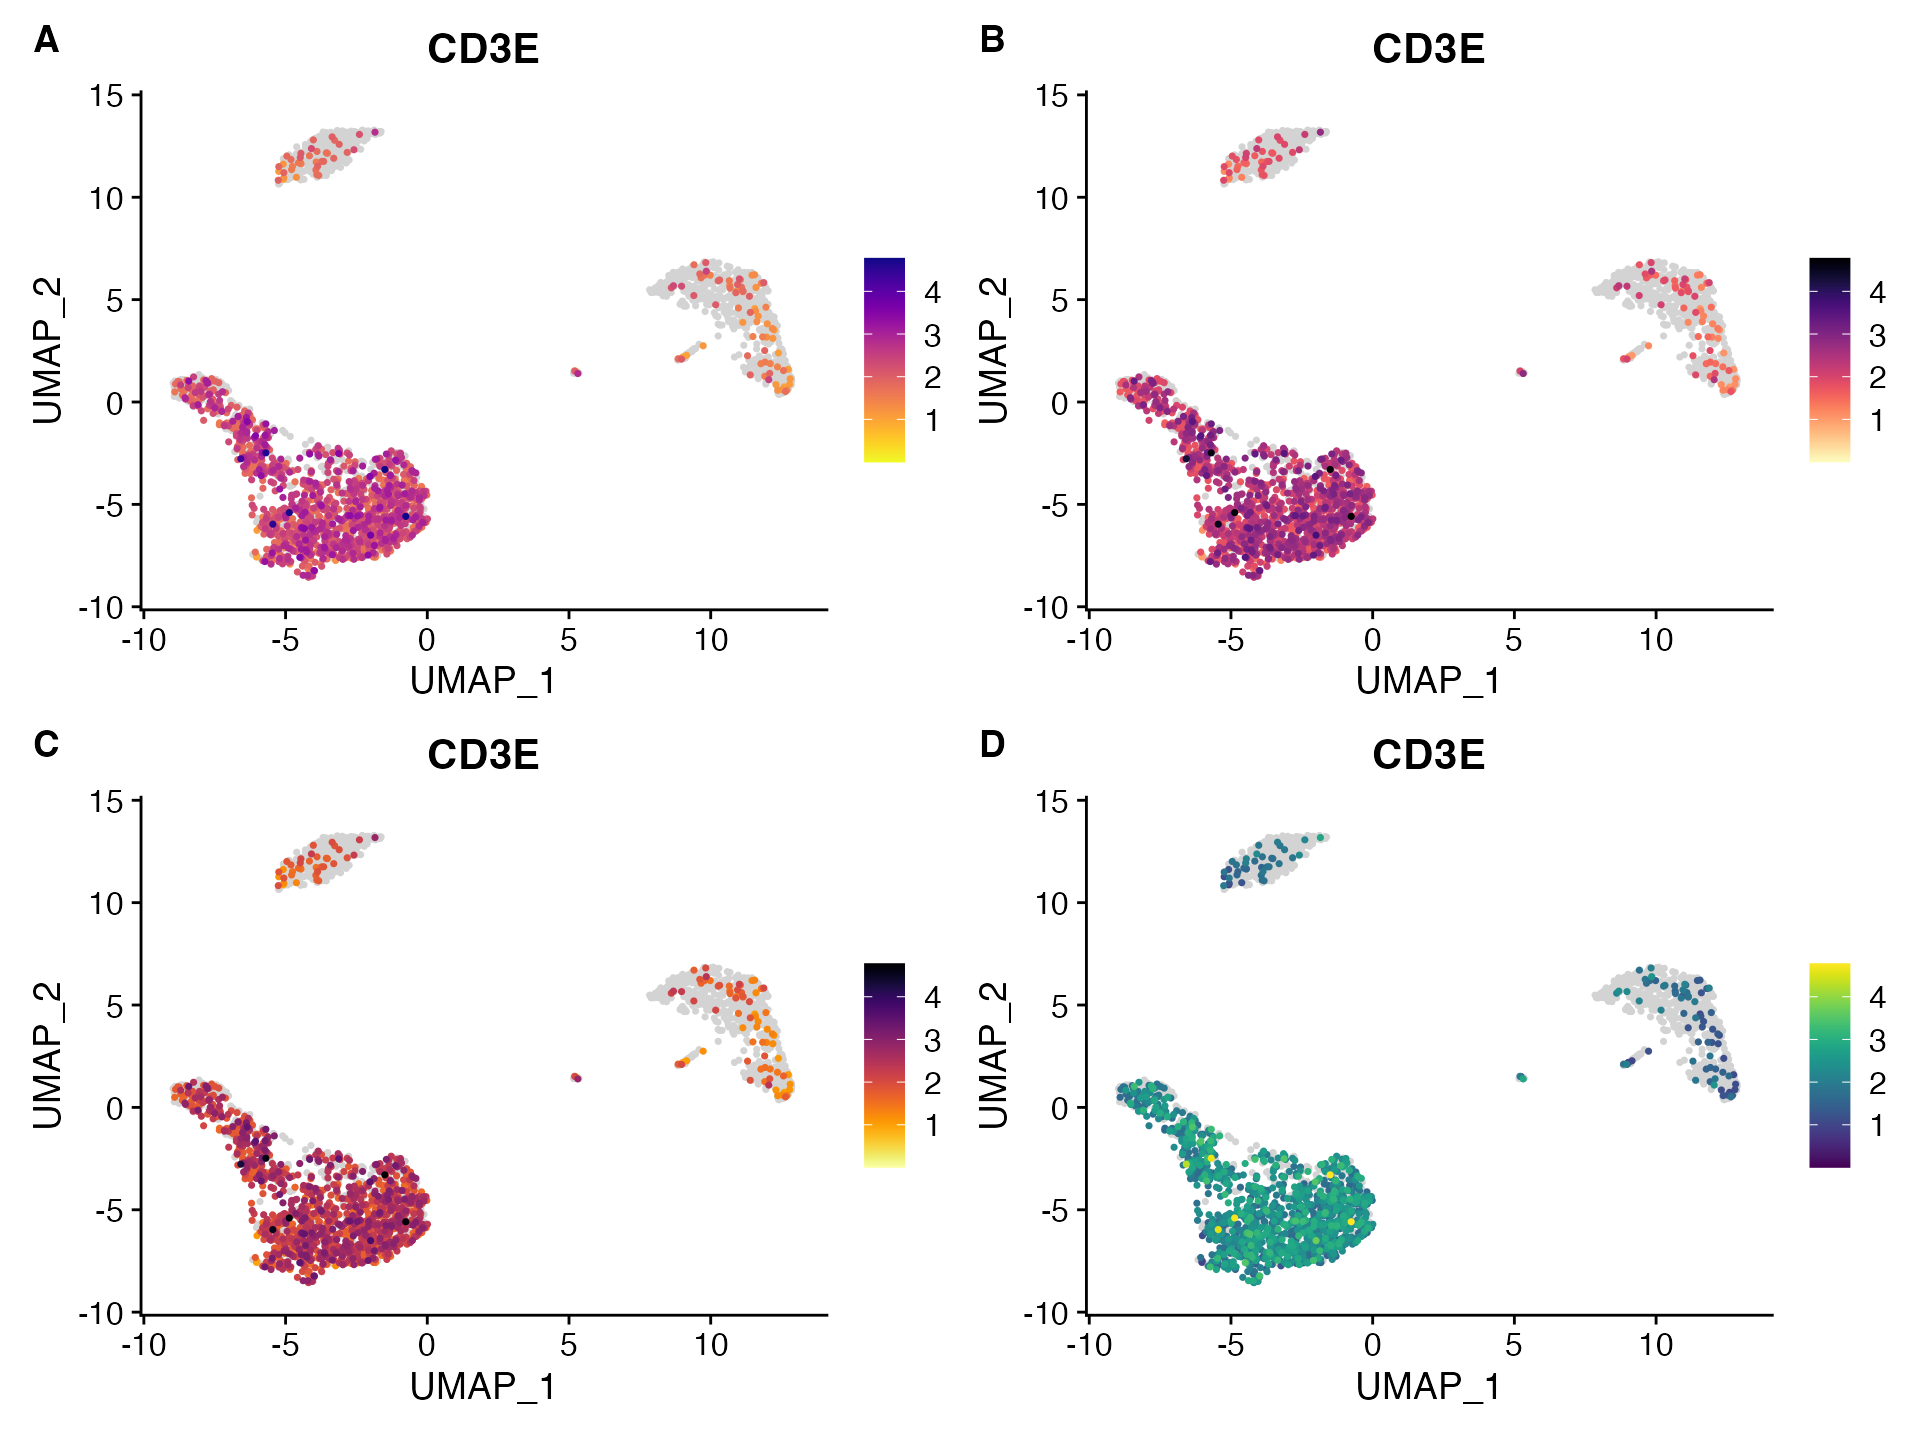
These palettes provided better contrast for continuous palettes. In
scCustomize the default is viridis_plasma_dark_high
Large Discrete Palettes
DiscretePalette_scCustomize()
The function DiscretePalette_scCustomize is function
inspired and modified from Seurat::DiscretePalette(). Under
the hood most of the palettes are called using paletteer package
to call palettes without adding package dependencies. The following
palettes can be specified:
- alphabet (24)
- alphabet2 (24)
- glasbey (32)
- polychrome (36)
- stepped (24)
- ditto_seq (40)
- varibow (Dynamic)
Palettes can either be saved to global environment as variable or called directly within other functions:
# Save as variable to global environment
polychrome_pal <- DiscretePalette_scCustomize(num_colors = 36, palette = "polychrome")

# Call within another function
DimPlot_scCustom(seurat_object = obj_name, colors_use = DiscretePalette_scCustomize(num_colors = 26,
    palette = "polychrome"))
The “polychrome” palette is the new default for plots with <36 levels and “varibow” when more than 36 levels
DimPlot_scCustom(seurat_object = pbmc)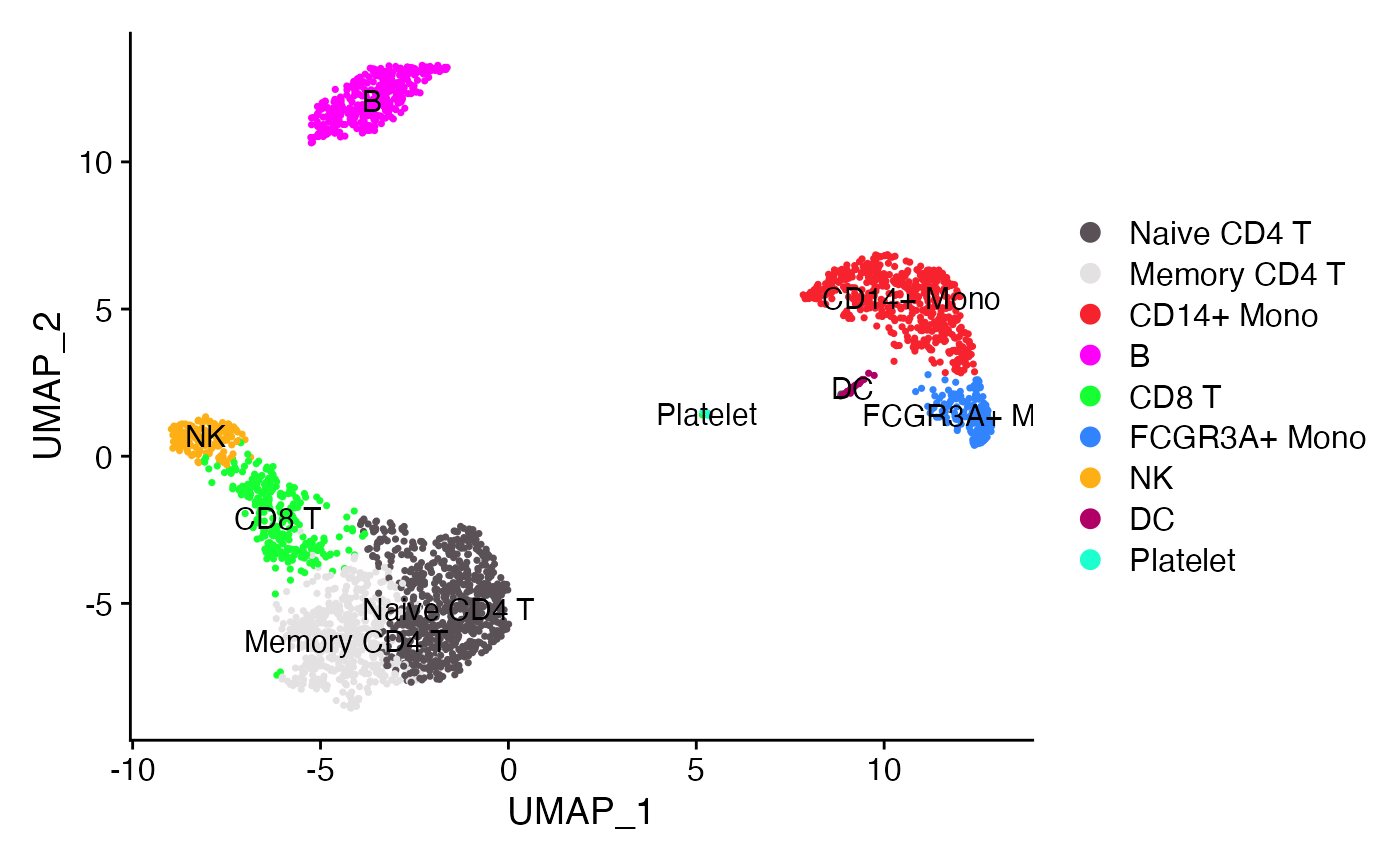
Visualize Palettes
To visualize these or any other palette you can use the
PalettePlot() function.
PalettePlot(pal = DiscretePalette_scCustomize(num_colors = 26, palette = "alphabet"))

PalettePlot(pal = c("color1", "color2", ...))


Dynamic Palettes
Among the discrete palettes provide the “varibow” palette is actually
a dynamic palette whose colors will adjust across the rainbow according
to num_colors provided:


Shuffle Palettes
Sometimes it can be helpful to use different order for the discrete
palettes depending on the end plot generated (This can be especially
true with “varibow” sometimes). DiscretePalette_scCustomize
has optional parameter that will randomly shuffle the returned palette
(see shuffle_pal and seed parameter to allow
for reproducible shuffling.)
PalettePlot(pal = DiscretePalette_scCustomize(num_colors = 30, palette = "varibow")) + ggtitle("varibow (normal)")
PalettePlot(pal = DiscretePalette_scCustomize(num_colors = 30, palette = "varibow"), shuffle_pal = TRUE) +
    ggtitle("varibow (shuffled)")

Small Discrete Palettes
Finally scCustomize contains shortcuts for some shorter discrete
palettes that can be useful for plotting groups, treatments, genotypes,
etc.


Themes & Plot Helpers
ggplot2 themeing works absolutely great but can also be simplified by wrapping commonly used post-plot themes into less verbose functions.
scCustomize contains a few customized themes and ggplot2 helpers that
simplify post plot themeing/alterations.
NOTE: These functions can be used with any ggplot2 plot and are not
limited to modifying scCustomize plots.
-
UnRotate_X()Undo x-axis label rotation -
Move_Legend()Select new location to move legend -
Blank_Theme()Removes all axis labels and axes from plot -
theme_ggprism_mod()Modified version ofggprism::theme_prism()
Suggestions/Enhancements?
If you have any ideas for additional color palettes that would be helpful to add or ggplot2 themeing functions please post as Pull Request on GitHub!