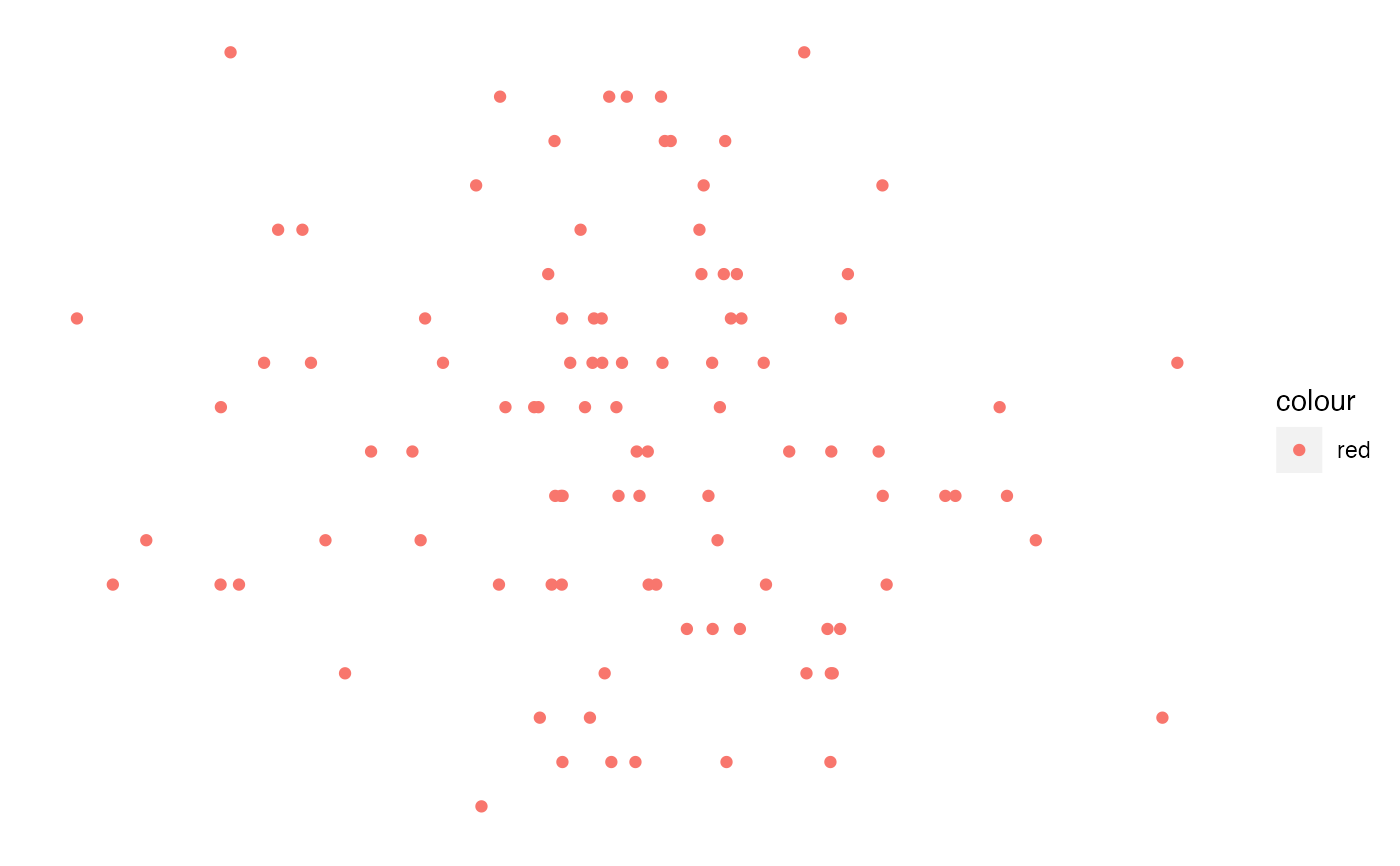
Shortcut for thematic modification to remove all axis labels and grid lines
Blank_Theme(...)Arguments
- ...
extra arguments passed to
ggplot2::theme().
Value
Returns a list-like object of class theme.
Examples
# Generate a plot and customize theme
library(ggplot2)
df <- data.frame(x = rnorm(n = 100, mean = 20, sd = 2), y = rbinom(n = 100, size = 100, prob = 0.2))
p <- ggplot(data = df, mapping = aes(x = x, y = y)) + geom_point(mapping = aes(color = 'red'))
p + Blank_Theme()
