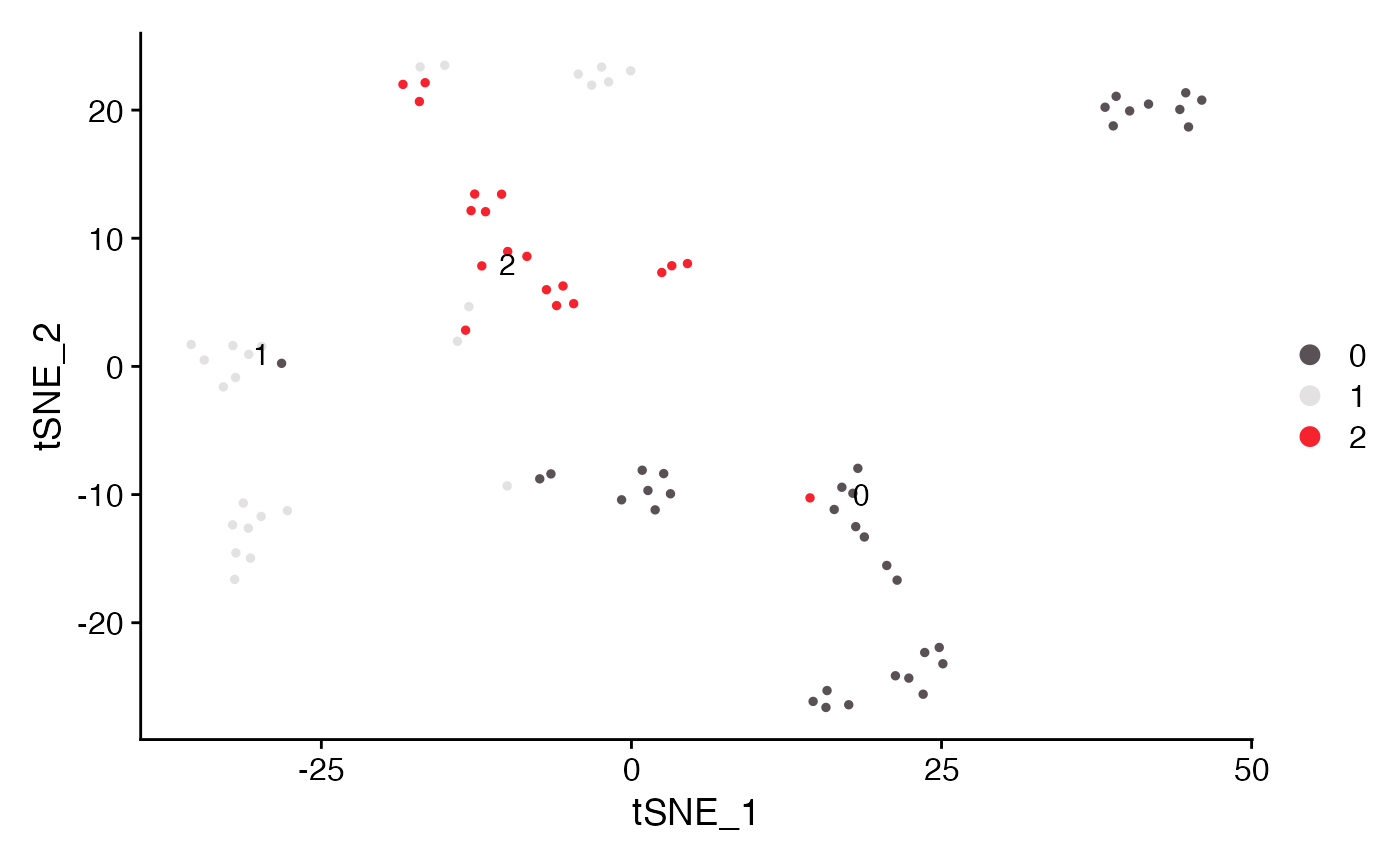
Creates DimPlot with some of the settings modified from their Seurat defaults (colors_use, shuffle, label).
DimPlot_scCustom(
  seurat_object,
  colors_use = NULL,
  pt.size = NULL,
  reduction = NULL,
  group.by = NULL,
  split.by = NULL,
  split_downsample = FALSE,
  split_seurat = FALSE,
  figure_plot = FALSE,
  aspect_ratio = NULL,
  add_prop_plot = FALSE,
  prop_plot_percent = FALSE,
  prop_plot_x_log = FALSE,
  prop_plot_label = FALSE,
  shuffle = TRUE,
  seed = 1,
  label = NULL,
  label.size = 4,
  label.color = "black",
  label.box = FALSE,
  dims = c(1, 2),
  repel = FALSE,
  raster = NULL,
  raster.dpi = c(512, 512),
  num_columns = NULL,
  ggplot_default_colors = FALSE,
  downsample_seed = 123,
  color_seed = 123,
  ...
)
Arguments
- seurat_object
Seurat object name.
- colors_use
color palette to use for plotting. By default if number of levels plotted is less than or equal to 36 it will use "polychrome" and if greater than 36 will use "varibow" with shuffle = TRUE both from
DiscretePalette_scCustomize.- pt.size
Adjust point size for plotting.
- reduction
Dimensionality Reduction to use (if NULL then defaults to Object default).
- group.by
Name of one or more metadata columns to group (color) cells by (for example, orig.ident); default is the current active.ident of the object.
- split.by
Feature to split plots by (i.e. "orig.ident").
- split_downsample
logical, whether to downsample the split plots by number of cells in the smallest group. Default is FALSE.
- split_seurat
logical. Whether or not to display split plots like Seurat (shared y axis) or as individual plots in layout. Default is FALSE.
- figure_plot
logical. Whether to remove the axes and plot with legend on left of plot denoting axes labels. (Default is FALSE). Requires
split_seurat = TRUE.- aspect_ratio
Control the aspect ratio (y:x axes ratio length). Must be numeric value; Default is NULL.
- add_prop_plot
logical, whether to add plot to returned layout with the number of cells per identity (or percent of cells per identity). Default is FALSE.
- prop_plot_percent
logical, if
add_prop_plot = TRUEthis parameter controls whether proportion plot shows raw cell number or percent of cells per identity. Default is FALSE; plots raw cell number.- prop_plot_x_log
logical, if
add_prop_plot = TRUEthis parameter controls whether to change x axis to log10 scale (Default is FALSE).- prop_plot_label
logical, if
add_prop_plot = TRUEthis parameter controls whether to label the bars with total number of cells or percentages; Default is FALSE.- shuffle
logical. Whether to randomly shuffle the order of points. This can be useful for crowded plots if points of interest are being buried. (Default is TRUE).
- seed
Sets the seed if randomly shuffling the order of points.
- label
Whether to label the clusters. By default if
group.by = NULLlabel = TRUE, and otherwise it is FALSE.- label.size
Sets size of labels.
- label.color
Sets the color of the label text.
- label.box
Whether to put a box around the label text (geom_text vs geom_label).
- dims
Which dimensions to plot. Defaults to c(1,2) if not specified.
- repel
Repel labels.
- raster
Convert points to raster format. Default is NULL which will rasterize by default if greater than 200,000 cells.
- raster.dpi
Pixel resolution for rasterized plots, passed to geom_scattermore(). Default is c(512, 512).
- num_columns
Number of columns in plot layout. Only valid if
split.by != NULL.- ggplot_default_colors
logical. If
colors_use = NULL, Whether or not to return plot using default ggplot2 "hue" palette instead of default "polychrome" or "varibow" palettes.- downsample_seed
random seed to use when selecting random cells to downsample in plot. Default = 123.
- color_seed
random seed for the "varibow" palette shuffle if
colors_use = NULLand number of groups plotted is greater than 36. Default = 123.- ...
Extra parameters passed to
DimPlot.
Value
A ggplot object
References
Many of the param names and descriptions are from Seurat to facilitate ease of use as
this is simply a wrapper to alter some of the default parameters https://github.com/satijalab/seurat/blob/master/R/visualization.R (License: GPL-3).
figure_plot parameter/code modified from code by Tim Stuart via twitter: https://x.com/timoast/status/1526237116035891200?s=20&t=foJOF81aPSjr1t7pk1cUPg.