Create Plot with cluster of interest highlighted
Cluster_Highlight_Plot(
  seurat_object,
  cluster_name,
  highlight_color = NULL,
  background_color = "lightgray",
  pt.size = NULL,
  aspect_ratio = NULL,
  figure_plot = FALSE,
  raster = NULL,
  raster.dpi = c(512, 512),
  label = FALSE,
  split.by = NULL,
  split_seurat = FALSE,
  split_title_size = 15,
  num_columns = NULL,
  reduction = NULL,
  ggplot_default_colors = FALSE,
  ...
)
Arguments
- seurat_object
Seurat object name.
- cluster_name
Name(s) (or number(s)) identity of cluster to be highlighted.
- highlight_color
Color(s) to highlight cells. The default is NULL and plot will use
scCustomize_Palette().- background_color
non-highlighted cell colors.
- pt.size
point size for both highlighted cluster and background.
- aspect_ratio
Control the aspect ratio (y:x axes ratio length). Must be numeric value; Default is NULL.
- figure_plot
logical. Whether to remove the axes and plot with legend on left of plot denoting axes labels. (Default is FALSE). Requires
split_seurat = TRUE.- raster
Convert points to raster format. Default is NULL which will rasterize by default if greater than 200,000 cells.
- raster.dpi
Pixel resolution for rasterized plots, passed to geom_scattermore(). Default is c(512, 512).
- label
Whether to label the highlighted cluster(s). Default is FALSE.
- split.by
Feature to split plots by (i.e. "orig.ident").
- split_seurat
logical. Whether or not to display split plots like Seurat (shared y axis) or as individual plots in layout. Default is FALSE.
- split_title_size
size for plot title labels when using
split.by.- num_columns
Number of columns in plot layout. Only valid if
split.by != NULL.- reduction
Dimensionality Reduction to use (if NULL then defaults to Object default).
- ggplot_default_colors
logical. If
colors_use = NULL, Whether or not to return plot using default ggplot2 "hue" palette instead of default "polychrome" or "varibow" palettes.- ...
Extra parameters passed to
DimPlot.
Value
A ggplot object
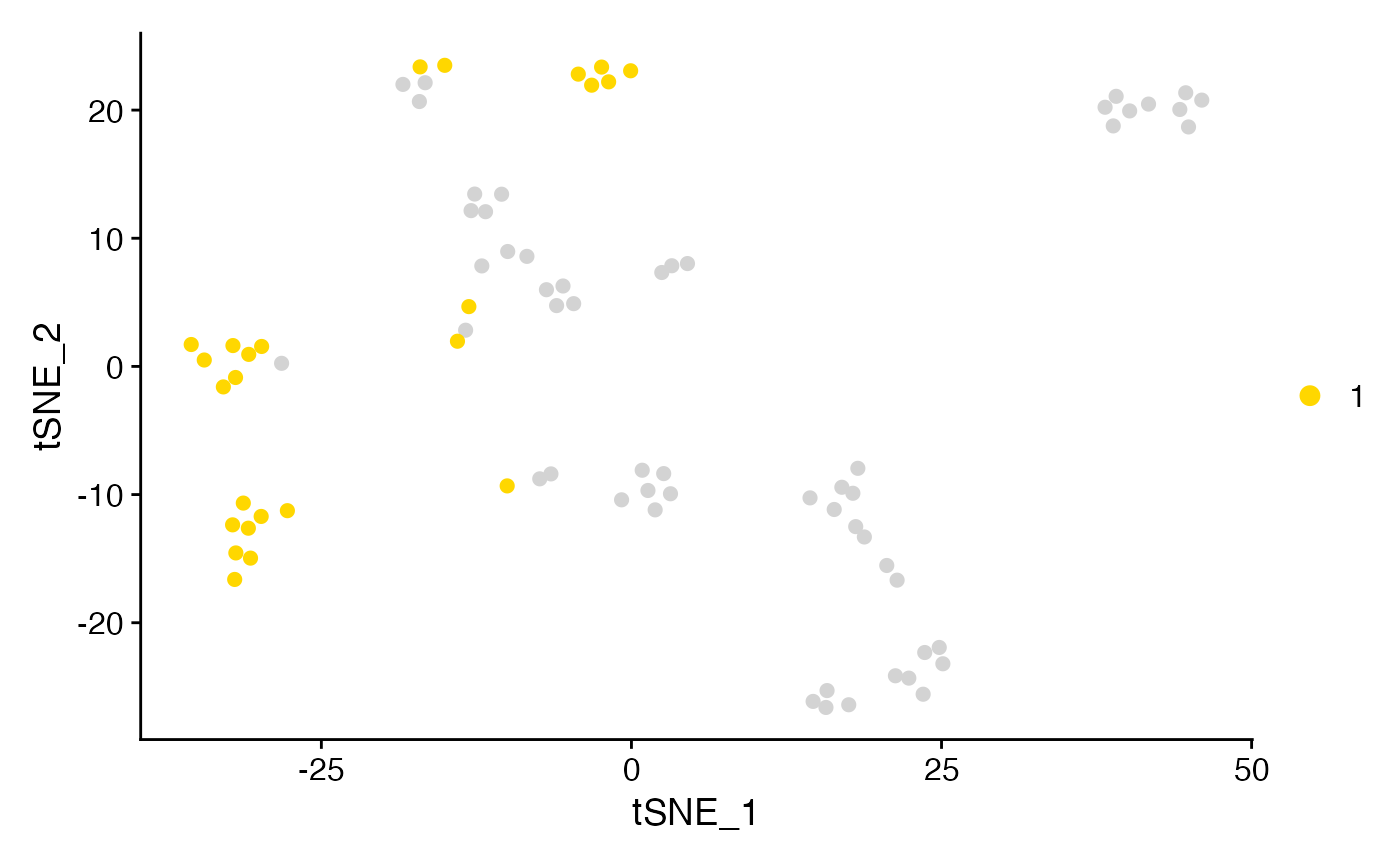
Examples
Cluster_Highlight_Plot(seurat_object = pbmc_small, cluster_name = "1", highlight_color = "gold",
background_color = "lightgray",  pt.size = 2)