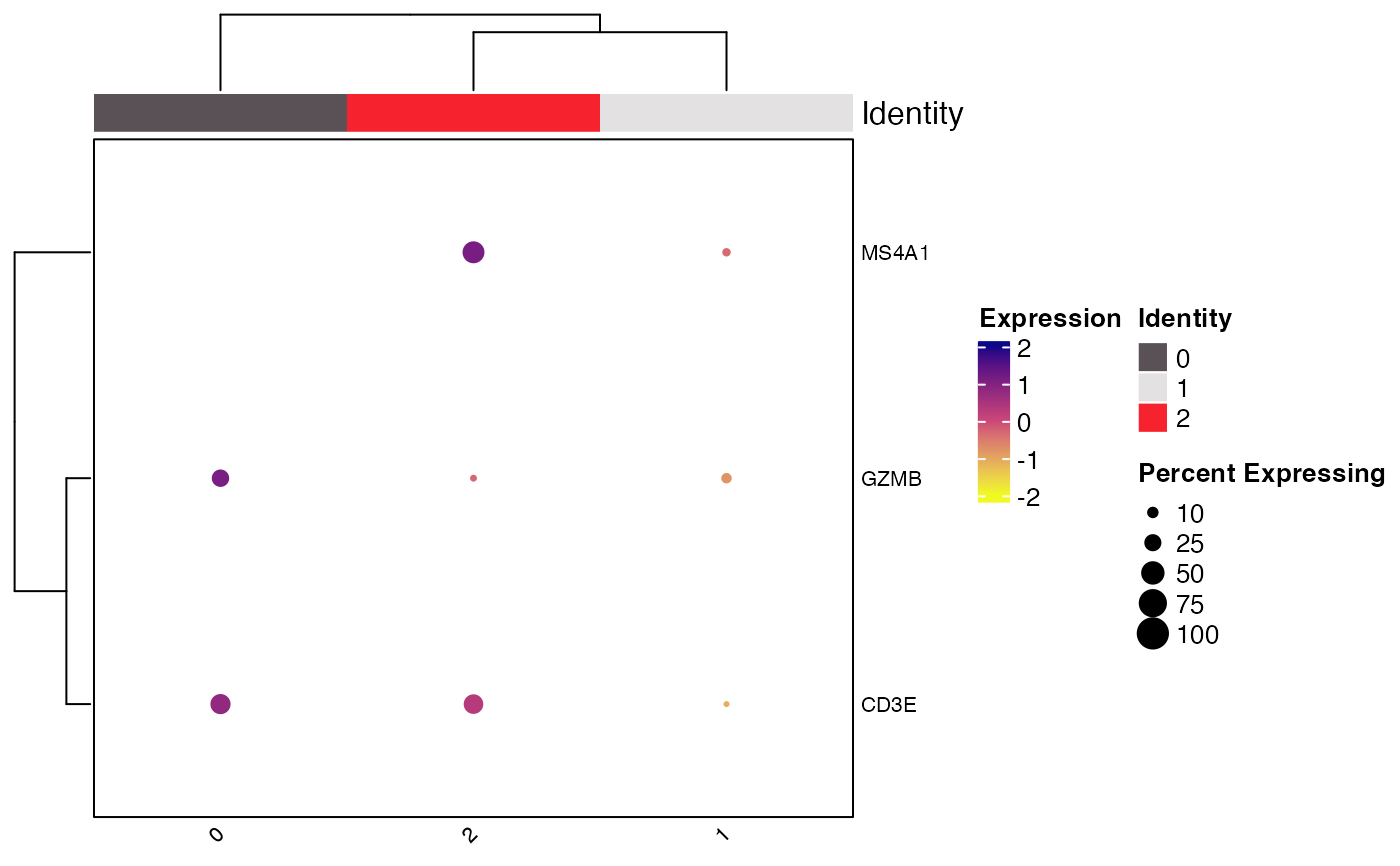
Clustered DotPlots using ComplexHeatmap
Clustered_DotPlot(
  seurat_object,
  features,
  label_selected_features = NULL,
  split.by = NULL,
  colors_use_exp = viridis_plasma_dark_high,
  exp_color_min = -2,
  exp_color_middle = NULL,
  exp_color_max = 2,
  exp_value_type = "scaled",
  print_exp_quantiles = FALSE,
  colors_use_idents = NULL,
  show_ident_colors = TRUE,
  show_annotation_name = TRUE,
  x_lab_rotate = TRUE,
  plot_padding = NULL,
  flip = FALSE,
  k = 1,
  feature_km_repeats = 1000,
  ident_km_repeats = 1000,
  row_label_size = 8,
  row_label_fontface = "plain",
  grid_color = NULL,
  cluster_feature = TRUE,
  cluster_ident = TRUE,
  column_label_size = 8,
  legend_label_size = 10,
  legend_title_size = 10,
  legend_position = "right",
  legend_orientation = NULL,
  show_ident_legend = TRUE,
  show_row_names = TRUE,
  show_column_names = TRUE,
  column_names_side = "bottom",
  row_names_side = "right",
  raster = FALSE,
  plot_km_elbow = TRUE,
  elbow_kmax = NULL,
  assay = NULL,
  group.by = NULL,
  idents = NULL,
  show_parent_dend_line = TRUE,
  nan_error = FALSE,
  ggplot_default_colors = FALSE,
  color_seed = 123,
  seed = 123
)
Arguments
- seurat_object
Seurat object name.
- features
Features to plot.
- label_selected_features
a subset of
featuresto only label some of the plotted features.- split.by
Variable in
@meta.datato split the identities plotted by.- colors_use_exp
Color palette to use for plotting expression scale. Default is
viridis::plasma(n = 20, direction = -1).- exp_color_min
Minimum scaled average expression threshold (everything smaller will be set to this). Default is -2.
- exp_color_middle
What scaled expression value to use for the middle of the provided
colors_use_exp. By default will be set to value in middle ofexp_color_minandexp_color_max.- exp_color_max
Minimum scaled average expression threshold (everything smaller will be set to this). Default is 2.
- exp_value_type
Whether to plot average normalized expression or scaled average normalized expression. Only valid when
split.byis provided.- print_exp_quantiles
Whether to print the quantiles of expression data in addition to plots. Default is FALSE. NOTE: These values will be altered by choices of
exp_color_minandexp_color_minif there are values below or above those cutoffs, respectively.- colors_use_idents
specify color palette to used for identity labels. By default if number of levels plotted is less than or equal to 36 it will use "polychrome" and if greater than 36 will use "varibow" with shuffle = TRUE both from
DiscretePalette_scCustomize.- show_ident_colors
logical, whether to show colors for idents on the column/rows of the plot (default is TRUE).
- show_annotation_name
logical, whether or not to show annotation name next to color bar. Default is TRUE.
- x_lab_rotate
How to rotate column labels. By default set to
TRUEwhich rotates labels 45 degrees. If setFALSErotation is set to 0 degrees. Users can also supply custom angle for text rotation.- plot_padding
if plot needs extra white space padding so no plot or labels are cutoff. The parameter accepts TRUE or numeric vector of length 4. If TRUE padding will be set to c(2, 10, 0 0) (bottom, left, top, right). Can also be customized further with numeric vector of length 4 specifying the amount of padding in millimeters. Default is NULL, no padding.
- flip
logical, whether to flip the axes of final plot. Default is FALSE; rows = features and columns = idents.
- k
Value to use for k-means clustering on features Sets (km) parameter in
ComplexHeatmap::Heatmap(). FromComplexHeatmap::Heatmap(): Apply k-means clustering on rows. If the value is larger than 1, the heatmap will be split by rows according to the k-means clustering. For each row slice, hierarchical clustering is still applied with parameters above.- feature_km_repeats
Number of k-means runs to get a consensus k-means clustering for features. Note if
feature_km_repeatsis set to value greater than one, the final number of groups might be smaller than row_km, but this might mean the original row_km is not a good choice. Default is 1000.- ident_km_repeats
Number of k-means runs to get a consensus k-means clustering. Similar to
feature_km_repeats. Default is 1000.- row_label_size
Size of the feature labels. Provided to
row_names_gpin Heatmap call.- row_label_fontface
Fontface to use for row labels. Provided to
row_names_gpin Heatmap call.- grid_color
color to use for heatmap grid. Default is NULL which "removes" grid by using NA color.
- cluster_feature
logical, whether to cluster and reorder feature axis. Default is TRUE.
- cluster_ident
logical, whether to cluster and reorder identity axis. Default is TRUE.
- column_label_size
Size of the feature labels. Provided to
column_names_gpin Heatmap call.- legend_label_size
Size of the legend text labels. Provided to
labels_gpin Heatmap legend call.- legend_title_size
Size of the legend title text labels. Provided to
title_gpin Heatmap legend call.- legend_position
Location of the plot legend (default is "right").
- legend_orientation
Orientation of the legend (default is NULL).
- show_ident_legend
logical, whether to show the color legend for idents in plot (default is TRUE).
- show_row_names
logical, whether to show row names on plot (default is TRUE).
- show_column_names
logical, whether to show column names on plot (default is TRUE).
- column_names_side
Should the row names be on the "bottom" or "top" of plot. Default is "bottom".
- row_names_side
Should the row names be on the "left" or "right" of plot. Default is "right".
- raster
Logical, whether to render in raster format (faster plotting, smaller files). Default is FALSE.
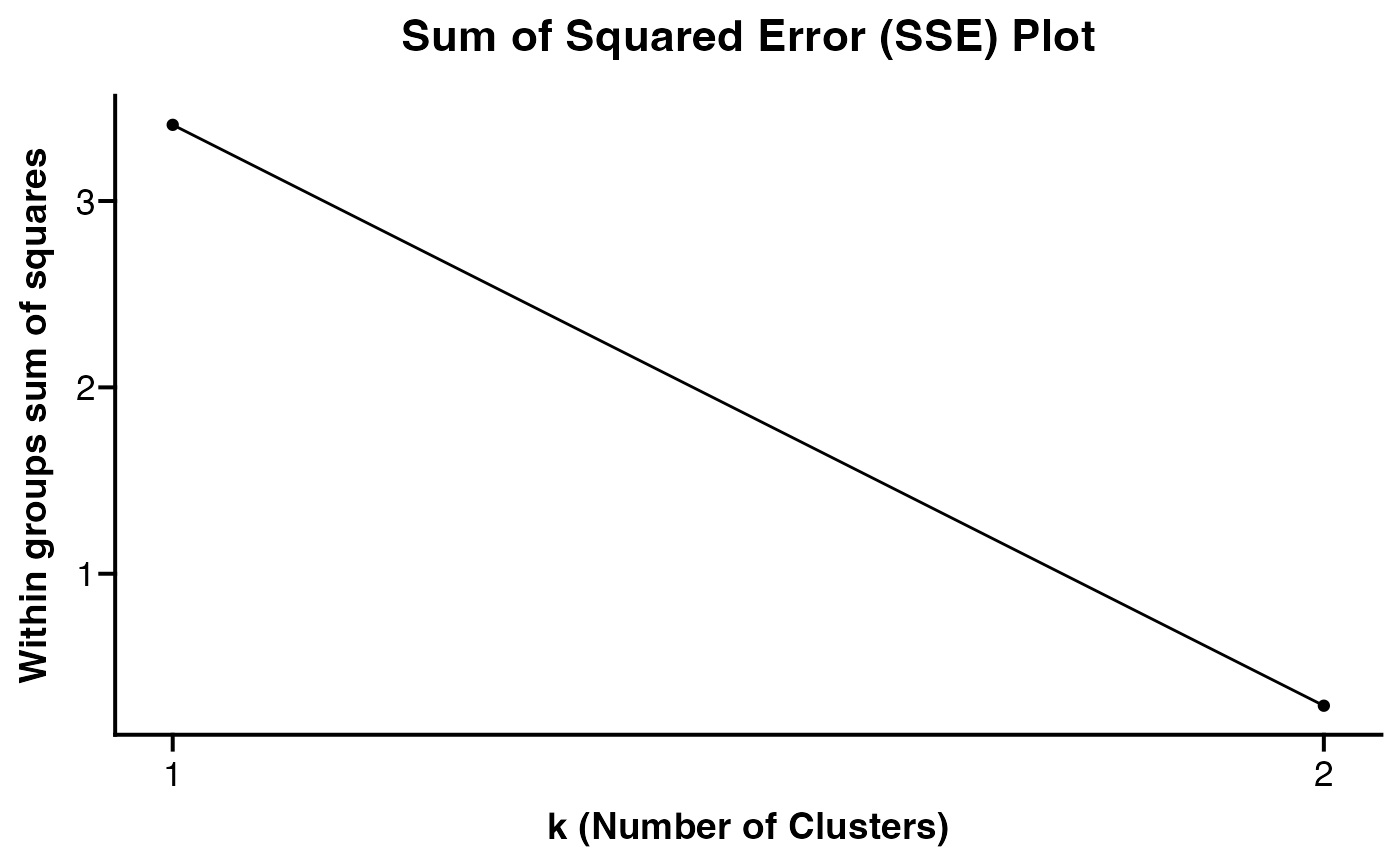
- plot_km_elbow
Logical, whether or not to return the Sum Squared Error Elbow Plot for k-means clustering. Estimating elbow of this plot is one way to determine "optimal" value for
k. Based on: https://stackoverflow.com/a/15376462/15568251.- elbow_kmax
The maximum value of k to use for
plot_km_elbow. Suggest setting larger value so the true shape of plot can be observed. Value must be 1 less than number of features provided. If NULL parameter will be set dependent on length of feature list up toelbow_kmax = 20.- assay
Name of assay to use, defaults to the active assay.
- group.by
Group (color) cells in different ways (for example, orig.ident).
- idents
Which classes to include in the plot (default is all).
- show_parent_dend_line
Logical, Sets parameter of same name in
ComplexHeatmap::Heatmap(). FromComplexHeatmap::Heatmap(): When heatmap is split, whether to add a dashed line to mark parent dendrogram and children dendrograms. Default is TRUE.- nan_error
logical, default is FALSE. ONLY set this value to true if you get error related to NaN values when attempting to use plotting function. Plotting may be slightly slower if TRUE depending on number of features being plotted.
- ggplot_default_colors
logical. If
colors_use = NULL, Whether or not to return plot using default ggplot2 "hue" palette instead of default "polychrome" or "varibow" palettes.- color_seed
random seed for the "varibow" palette shuffle if
colors_use = NULLand number of groups plotted is greater than 36. Default = 123.- seed
Sets seed for reproducible plotting (ComplexHeatmap plot).
Value
A ComplexHeatmap or if plot_km_elbow = TRUE a list containing ggplot2 object and ComplexHeatmap.
References
https://divingintogeneticsandgenomics.rbind.io/post/clustered-dotplot-for-single-cell-rnaseq/
See also
Examples
# \donttest{
library(Seurat)
Clustered_DotPlot(seurat_object = pbmc_small, features = c("CD3E", "CD8", "GZMB", "MS4A1"))
#> Warning: The following features were omitted as they were not found:
#> ℹ CD8
#> Warning: Scaling data with a low number of groups may produce misleading results
 #> [[1]]
 #>
#> [[2]]
#>
#> [[2]]
 #>
# }
#>
# }