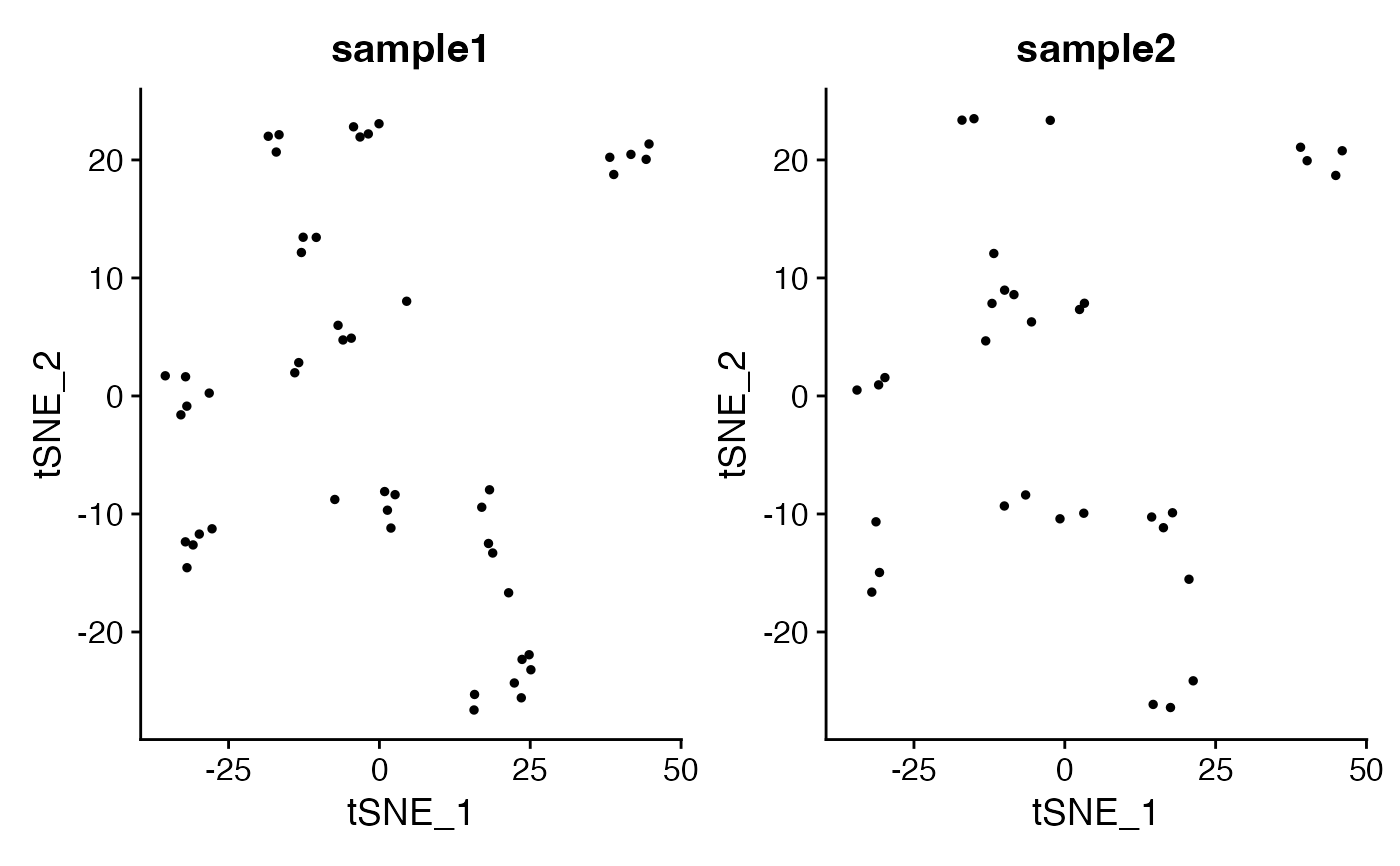
Creates DimPlot layout containing all samples within Seurat Object from orig.ident column
Arguments
- seurat_object
Seurat object name.
- meta_data_column
Meta data column to split plots by.
- colors_use
single color to use for all plots or a vector of colors equal to the number of plots.
- pt.size
Adjust point size for plotting.
- aspect_ratio
Control the aspect ratio (y:x axes ratio length). Must be numeric value; Default is NULL.
- title_size
size for plot title labels.
- num_columns
number of columns in final layout plot.
- reduction
Dimensionality Reduction to use (if NULL then defaults to Object default).
- dims
Which dimensions to plot. Defaults to c(1,2) if not specified.
- raster
Convert points to raster format. Default is NULL which will rasterize by default if greater than 200,000 cells.
- raster.dpi
Pixel resolution for rasterized plots, passed to geom_scattermore(). Default is c(512, 512).
- ...
Extra parameters passed to
DimPlot.
Value
A ggplot object
