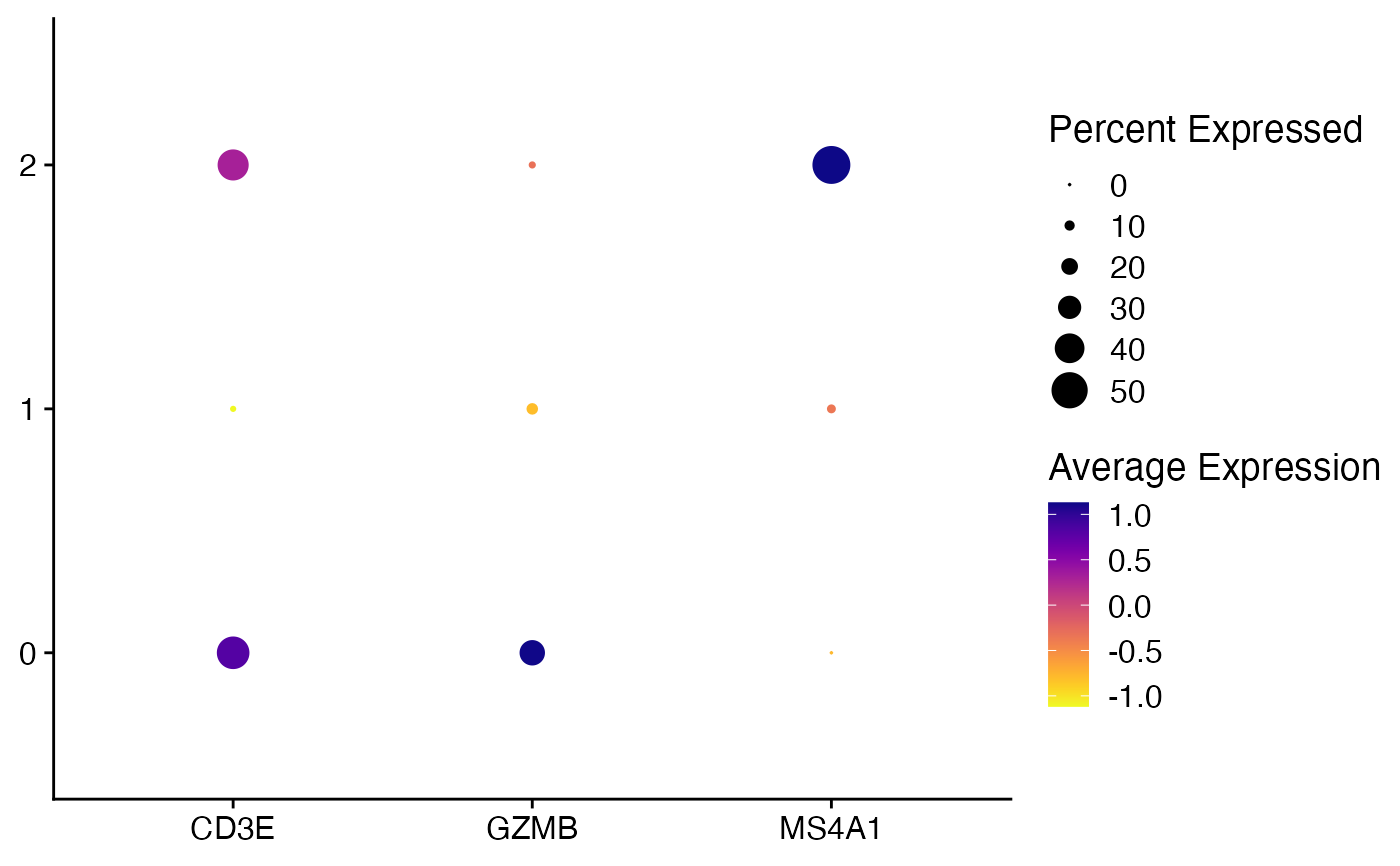
Code for creating customized DotPlot
DotPlot_scCustom(
  seurat_object,
  features,
  group.by = NULL,
  colors_use = viridis_plasma_dark_high,
  remove_axis_titles = TRUE,
  x_lab_rotate = FALSE,
  y_lab_rotate = FALSE,
  facet_label_rotate = FALSE,
  flip_axes = FALSE,
  ...
)
Arguments
- seurat_object
Seurat object name.
- features
Features to plot.
- group.by
Name of metadata variable (column) to group cells by (for example, orig.ident); default is the current active.ident of the object.
- colors_use
specify color palette to used. Default is viridis_plasma_dark_high.
- remove_axis_titles
logical. Whether to remove the x and y axis titles. Default = TRUE.
- x_lab_rotate
Rotate x-axis labels 45 degrees (Default is FALSE).
- y_lab_rotate
Rotate x-axis labels 45 degrees (Default is FALSE).
- facet_label_rotate
Rotate facet labels on grouped
DotPlotsby 45 degrees (Default is FALSE).- flip_axes
whether or not to flip and X and Y axes (Default is FALSE).
- ...
Extra parameters passed to
DotPlot.
Value
A ggplot object