Create customized FeatureScatter plots with scCustomize defaults.
FeatureScatter_scCustom(
  seurat_object,
  feature1 = NULL,
  feature2 = NULL,
  cells = NULL,
  colors_use = NULL,
  pt.size = NULL,
  group.by = NULL,
  split.by = NULL,
  split_seurat = FALSE,
  shuffle = TRUE,
  aspect_ratio = NULL,
  title_size = 15,
  plot.cor = TRUE,
  num_columns = NULL,
  raster = NULL,
  raster.dpi = c(512, 512),
  ggplot_default_colors = FALSE,
  color_seed = 123,
  ...
)
Arguments
- seurat_object
Seurat object name.
- feature1
First feature to plot.
- feature2
Second feature to plot.
- cells
Cells to include on the scatter plot.
- colors_use
color for the points on plot.
- pt.size
Adjust point size for plotting.
- group.by
Name of one or more metadata columns to group (color) cells by (for example, orig.ident). Default is active ident.
- split.by
Feature to split plots by (i.e. "orig.ident").
- split_seurat
logical. Whether or not to display split plots like Seurat (shared y axis) or as individual plots in layout. Default is FALSE.
- shuffle
logical, whether to randomly shuffle the order of points. This can be useful for crowded plots if points of interest are being buried. Default is TRUE.
- aspect_ratio
Control the aspect ratio (y:x axes ratio length). Must be numeric value; Default is NULL.
- title_size
size for plot title labels. Does NOT apply if
split_seurat = TRUE.- plot.cor
Display correlation in plot subtitle (or title if
split_seurat = TRUE).- num_columns
number of columns in final layout plot.
- raster
Convert points to raster format. Default is NULL which will rasterize by default if greater than 200,000 cells.
- raster.dpi
Pixel resolution for rasterized plots, passed to geom_scattermore(). Default is c(512, 512).
- ggplot_default_colors
logical. If
colors_use = NULL, Whether or not to return plot using default ggplot2 "hue" palette instead of default "polychrome" or "varibow" palettes.- color_seed
random seed for the "varibow" palette shuffle if
colors_use = NULLand number of groups plotted is greater than 36. Default = 123.- ...
Extra parameters passed to
FeatureScatter.
Value
A ggplot object
Examples
# \donttest{
library(Seurat)
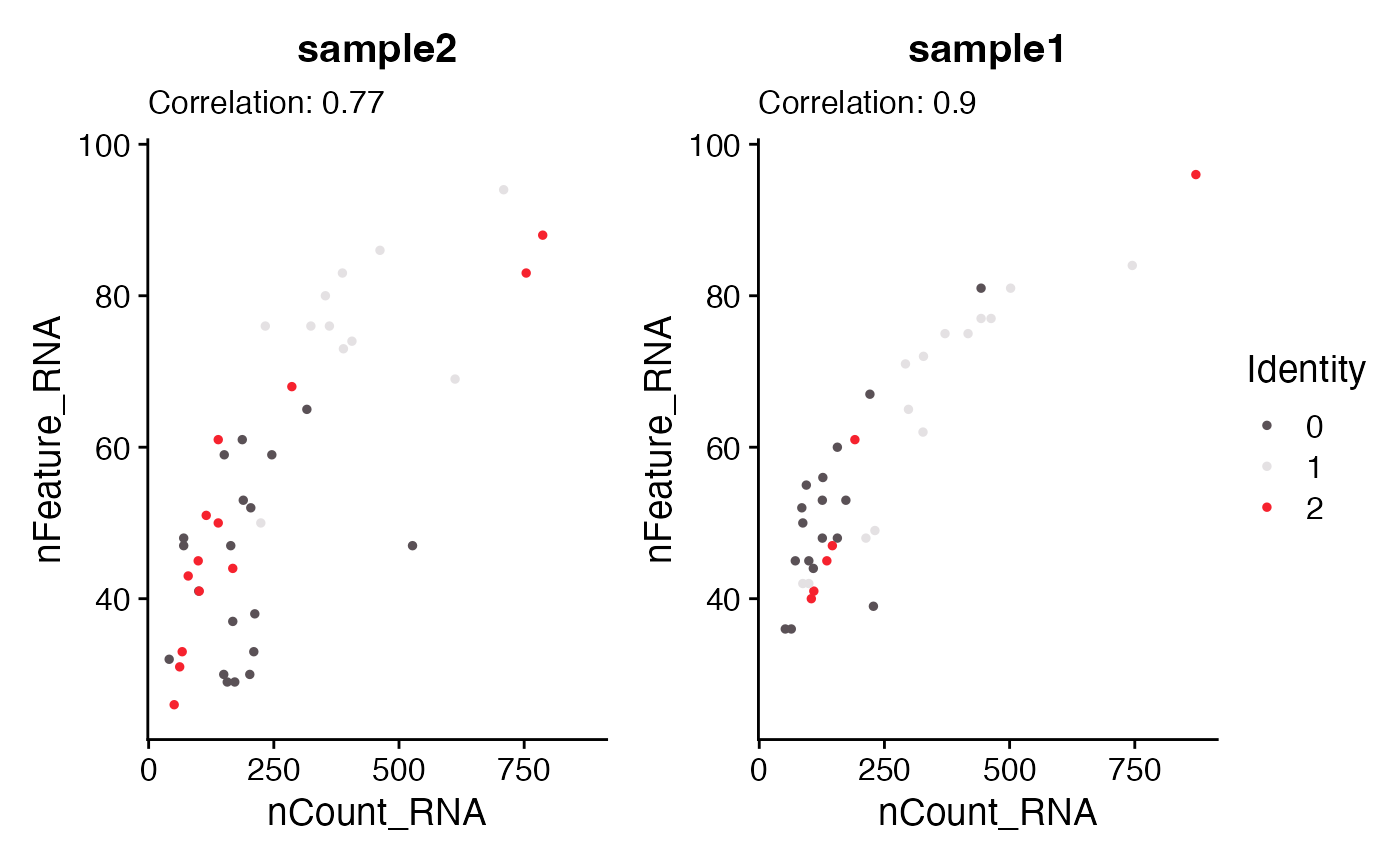
pbmc_small$sample_id <- sample(c("sample1", "sample2"), size = ncol(pbmc_small), replace = TRUE)
FeatureScatter_scCustom(seurat_object = pbmc_small, feature1 = "nCount_RNA",
feature2 = "nFeature_RNA", split.by = "sample_id")
#>
#> NOTE: FeatureScatter_scCustom returns split plots as layout of all plots each
#> with their own axes as opposed to Seurat which returns with shared x or y axis.
#> To return to Seurat behvaior set `split_seurat = TRUE`.
#>
#> -----This message will be shown once per session.-----
 # }
# }