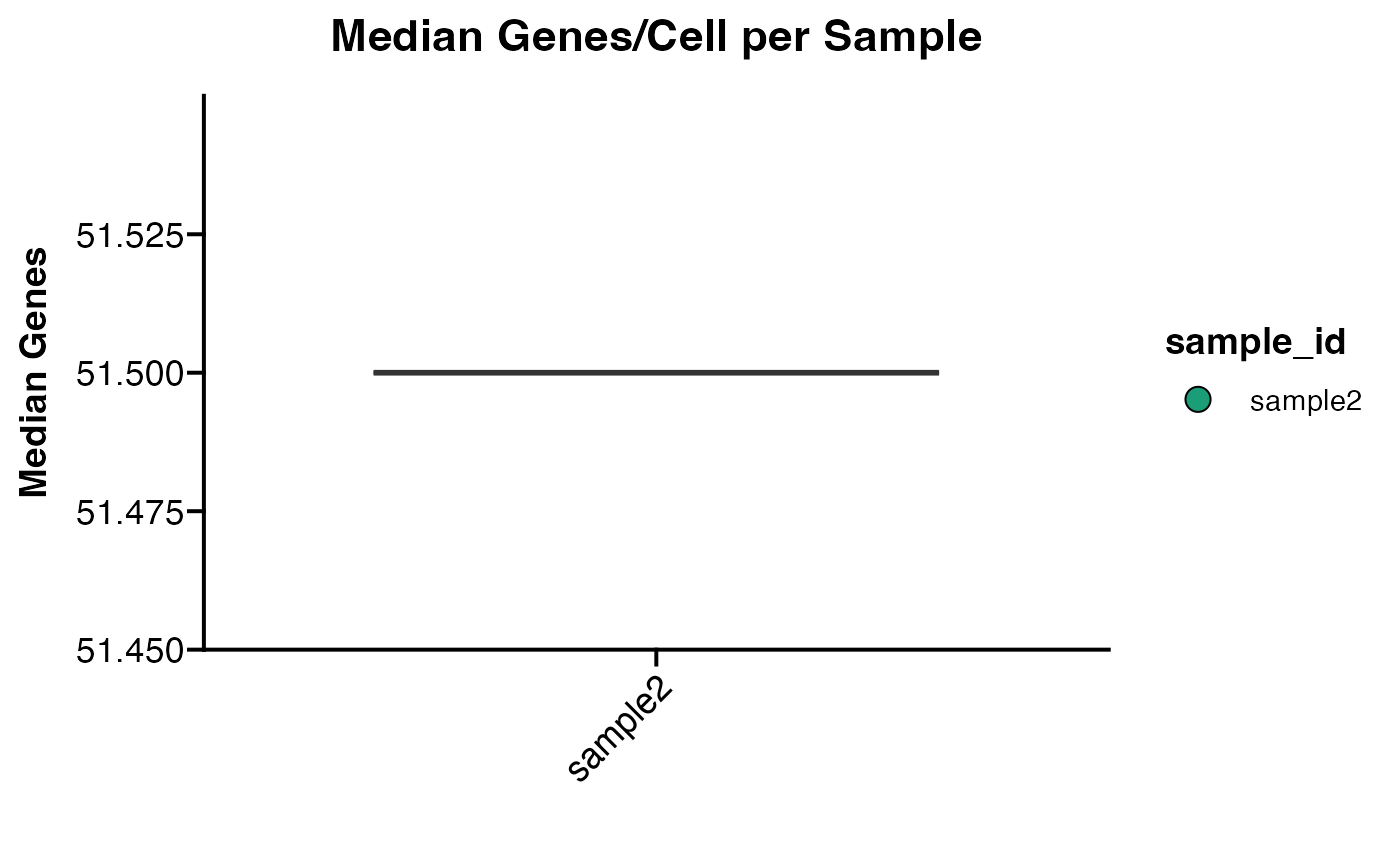
Plot of median genes per cell per sample grouped by desired meta data variable.
Plot_Median_Genes(
  seurat_object,
  sample_col = "orig.ident",
  group.by = NULL,
  colors_use = NULL,
  dot_size = 1,
  plot_title = "Median Genes/Cell per Sample",
  y_axis_label = "Median Genes",
  x_axis_label = NULL,
  legend_title = NULL,
  x_lab_rotate = TRUE,
  color_seed = 123
)
Arguments
- seurat_object
Seurat object name.
- sample_col
Specify which column in meta.data specifies sample ID (i.e. orig.ident).
- group.by
Column in meta.data slot to group results by (i.e. "Treatment").
- colors_use
List of colors or color palette to use. Only applicable if
group.byis not NULL.- dot_size
size of the dots plotted if
group.byis not NULL. Default is 1.- plot_title
Plot title.
- y_axis_label
Label for y axis.
- x_axis_label
Label for x axis.
- legend_title
Label for plot legend.
- x_lab_rotate
logical. Whether to rotate the axes labels on the x-axis. Default is FALSE.
- color_seed
random seed for the "varibow" palette shuffle if
colors_use = NULLand number of groups plotted is greater than 36. Default = 123.
Value
A ggplot object
Examples
library(Seurat)
# Create example groups
pbmc_small$sample_id <- sample(c("sample1", "sample2"), size = ncol(pbmc_small), replace = TRUE)

# Plot
Plot_Median_Genes(seurat_object = pbmc_small, sample_col = "orig.ident",  group.by = "sample_id")
#> Bin width defaults to 1/30 of the range of the data. Pick better value with
#> `binwidth`.