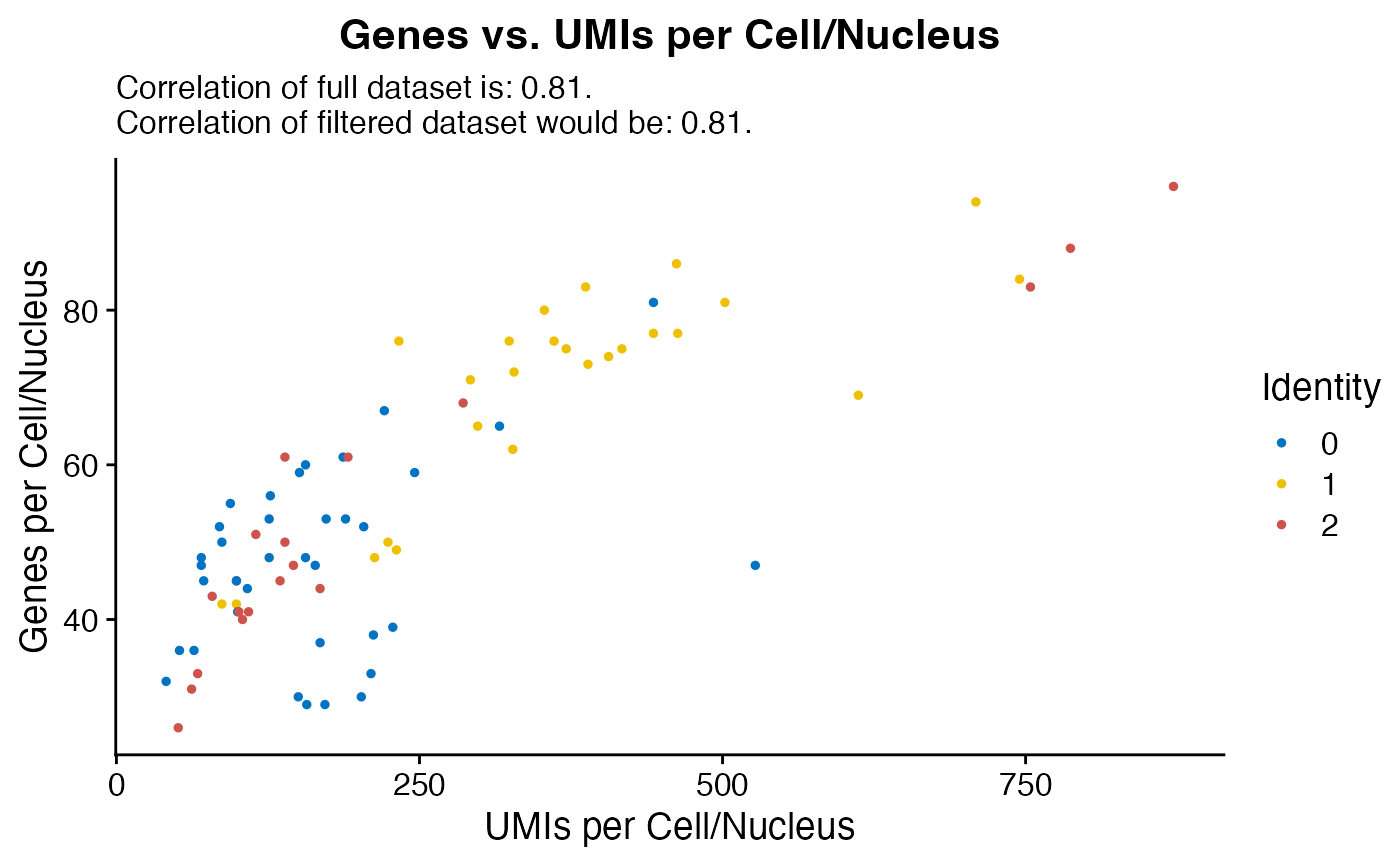
Custom FeatureScatter for initial QC checks including lines for thresholding
QC_Plot_UMIvsGene(
  seurat_object,
  x_axis_label = "UMIs per Cell/Nucleus",
  y_axis_label = "Genes per Cell/Nucleus",
  low_cutoff_gene = -Inf,
  high_cutoff_gene = Inf,
  low_cutoff_UMI = -Inf,
  high_cutoff_UMI = Inf,
  cutoff_line_width = deprecated(),
  cutoff_linewidth = NULL,
  colors_use = NULL,
  meta_gradient_name = NULL,
  meta_gradient_color = viridis_plasma_dark_high,
  meta_gradient_na_color = "lightgray",
  meta_gradient_low_cutoff = NULL,
  cells = NULL,
  combination = FALSE,
  ident_legend = TRUE,
  pt.size = 1,
  group.by = NULL,
  raster = NULL,
  raster.dpi = c(512, 512),
  assay = NULL,
  ggplot_default_colors = FALSE,
  color_seed = 123,
  shuffle_seed = 1,
  ...
)
Arguments
- seurat_object
Seurat object name.
- x_axis_label
Label for x axis.
- y_axis_label
Label for y axis.
- low_cutoff_gene
Plot line a potential low threshold for filtering genes per cell.
- high_cutoff_gene
Plot line a potential high threshold for filtering genes per cell.
- low_cutoff_UMI
Plot line a potential low threshold for filtering UMIs per cell.
- high_cutoff_UMI
Plot line a potential high threshold for filtering UMIs per cell.
- cutoff_line_width
![[Soft-deprecated]](figures/lifecycle-soft-deprecated.svg) . See
. See cutoff_linewidth.- cutoff_linewidth
numerical value for thickness of cutoff lines, default is NULL, uses ggplot2 defaults.
- colors_use
vector of colors to use for plotting by identity.
- meta_gradient_name
Name of continuous meta data variable to color points in plot by. (MUST be continuous variable i.e. "percent_mito").
- meta_gradient_color
The gradient color palette to use for plotting of meta variable (default is viridis "Plasma" palette with dark colors high).
- meta_gradient_na_color
Color to use for plotting values when a
meta_gradient_low_cutoffis set (default is "lightgray").- meta_gradient_low_cutoff
Value to use as threshold for plotting.
meta_gradient_namevalues below this value will be plotted usingmeta_gradient_na_color.- cells
Cells to include on the scatter plot (default is all cells).
- combination
logical (default FALSE). Whether or not to return a plot layout with both the plot colored by identity and the meta data gradient plot.
- ident_legend
logical, whether to plot the legend containing identities (left plot) when
combination = TRUE. Default is TRUE.- pt.size
Passes size of points to both
FeatureScatterandgeom_point.- group.by
Name of one or more metadata columns to group (color) cells by (for example, orig.ident). Default is
@active.ident.- raster
Convert points to raster format. Default is NULL which will rasterize by default if greater than 100,000 cells.
- raster.dpi
Pixel resolution for rasterized plots, passed to geom_scattermore(). Default is c(512, 512).
- assay
Name of assay to use, defaults to the active assay.
- ggplot_default_colors
logical. If
colors_use = NULL, Whether or not to return plot using default ggplot2 "hue" palette instead of default "polychrome" or "varibow" palettes.- color_seed
Random seed for the "varibow" palette shuffle if
colors_use = NULLand number of groups plotted is greater than 36. Default = 123.- shuffle_seed
Sets the seed if randomly shuffling the order of points (Default is 1).
- ...
Extra parameters passed to
FeatureScatter.
Value
A ggplot object