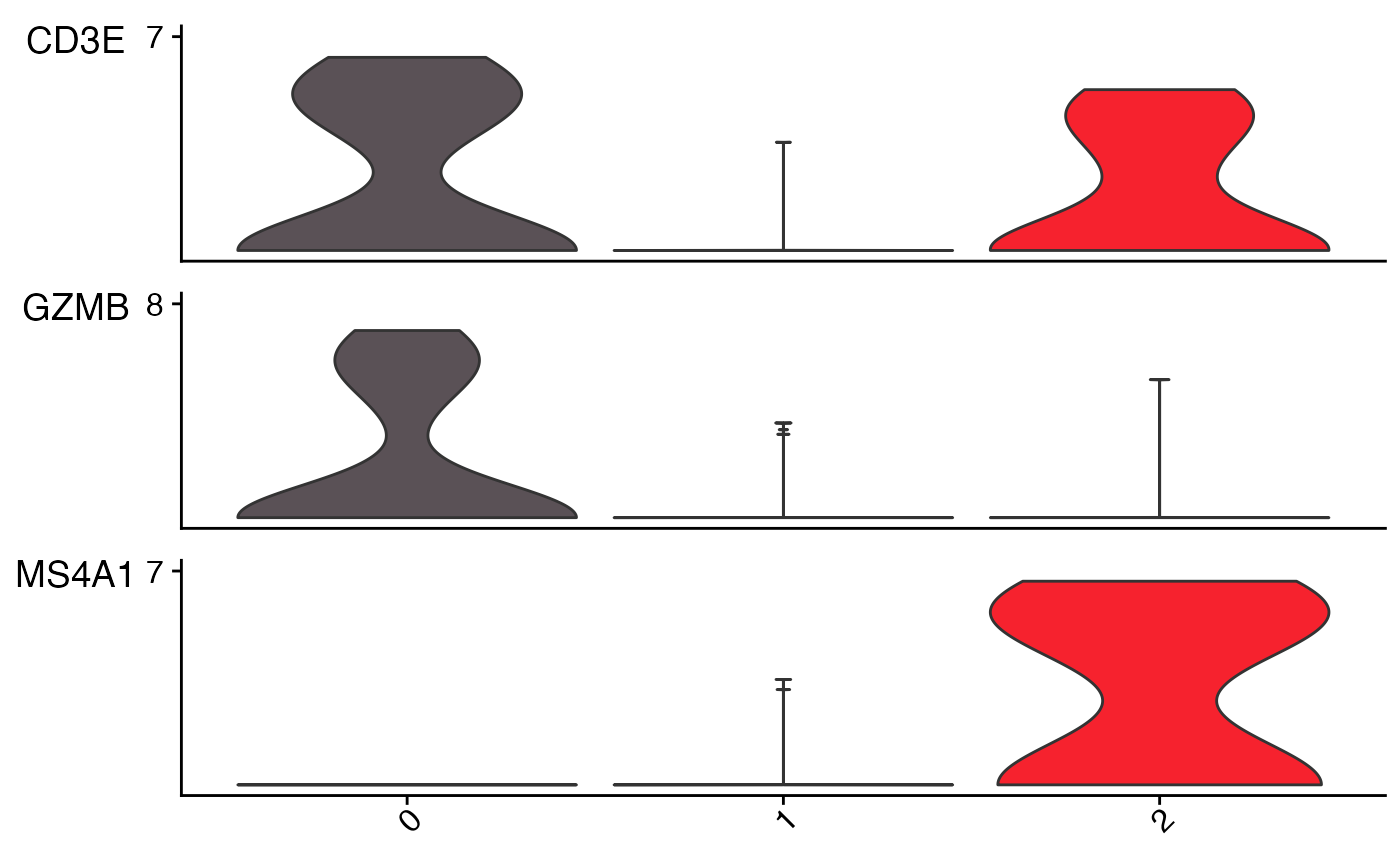
Code for creating stacked violin plot gene expression.
Stacked_VlnPlot(
  seurat_object,
  features,
  group.by = NULL,
  split.by = NULL,
  idents = NULL,
  x_lab_rotate = FALSE,
  plot_legend = FALSE,
  colors_use = NULL,
  color_seed = 123,
  ggplot_default_colors = FALSE,
  plot_spacing = 0.15,
  spacing_unit = "cm",
  vln_linewidth = NULL,
  pt.size = NULL,
  raster = NULL,
  add.noise = TRUE,
  ...
)
Arguments
- seurat_object
Seurat object name.
- features
Features to plot.
- group.by
Group (color) cells in different ways (for example, orig.ident).
- split.by
A variable to split the violin plots by,
- idents
Which classes to include in the plot (default is all).
- x_lab_rotate
logical or numeric. If logical whether to rotate x-axis labels 45 degrees (Default is FALSE). If numeric must be either 45 or 90. Setting 45 is equivalent to setting TRUE.
- plot_legend
logical. Adds plot legend containing
identsto the returned plot.- colors_use
specify color palette to used in
VlnPlot. By default if number of levels plotted is less than or equal to 36 it will use "polychrome" and if greater than 36 will use "varibow" with shuffle = TRUE both fromDiscretePalette_scCustomize.- color_seed
random seed for the "varibow" palette shuffle if
colors_use = NULLand number of groups plotted is greater than 36. Default = 123.- ggplot_default_colors
logical. If
colors_use = NULL, Whether or not to return plot using default ggplot2 "hue" palette instead of default "polychrome" or "varibow" palettes.- plot_spacing
Numerical value specifying the vertical spacing between each plot in the stack. Default is 0.15 ("cm"). Spacing dependent on unit provided to
spacing_unit.- spacing_unit
Unit to use in specifying vertical spacing between plots. Default is "cm".
- vln_linewidth
Adjust the linewidth of violin outline. Must be numeric.
- pt.size
Adjust point size for plotting. Default for
Stacked_VlnPlotis 0 to avoid issues with rendering so many points in vector form. Alternatively, seerasterparameter.- raster
Convert points to raster format. Default is NULL which will rasterize by default if greater than 200,000 total points plotted (# Cells x # of features).
- add.noise
logical, determine if adding a small noise for plotting (Default is TRUE).
- ...
Extra parameters passed to
VlnPlot.
Value
A ggplot object
