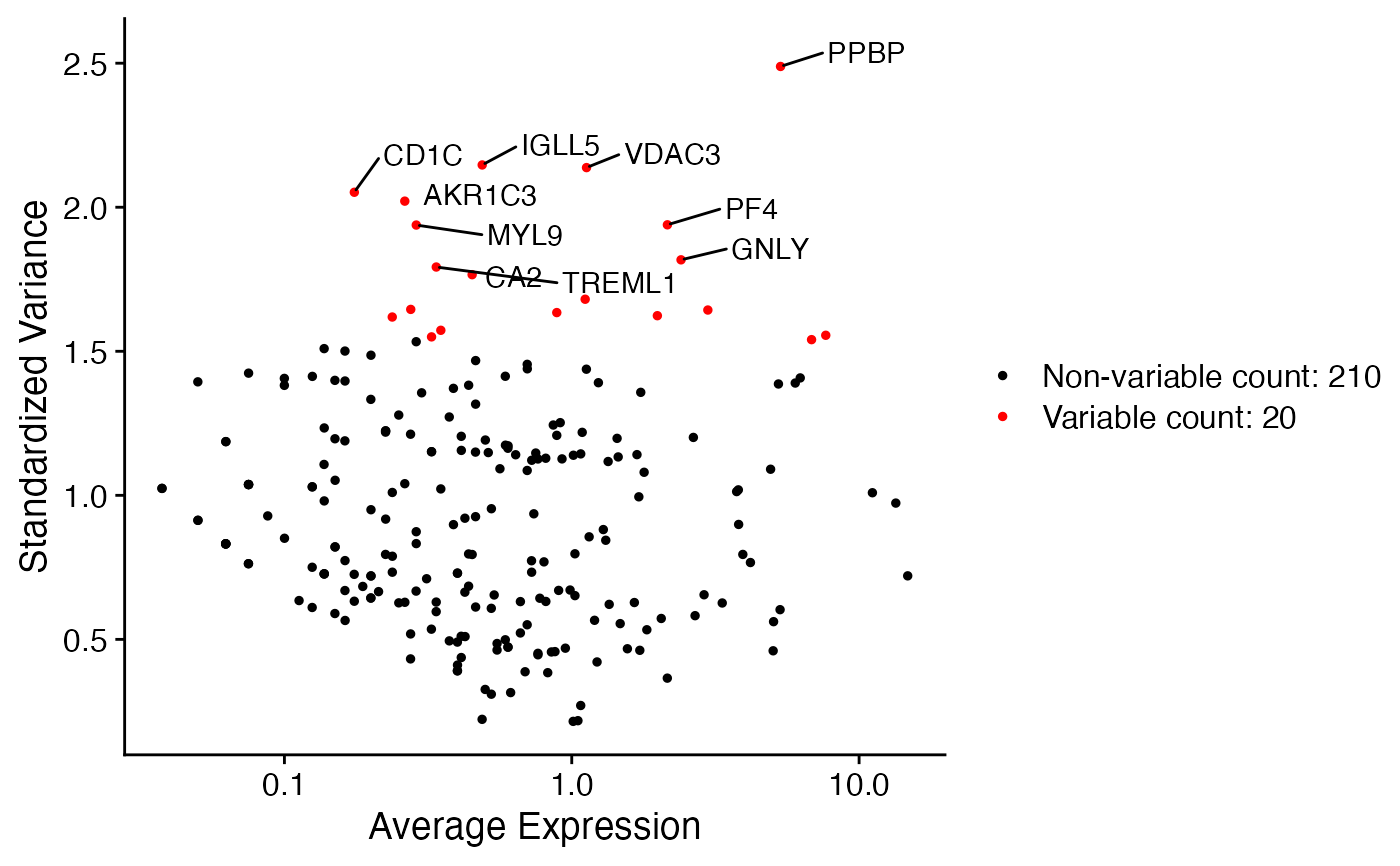
Creates variable features plot with N number of features already labeled by default.
VariableFeaturePlot_scCustom(
  seurat_object,
  num_features = 10,
  custom_features = NULL,
  label = TRUE,
  pt.size = 1,
  colors_use = c("black", "red"),
  repel = TRUE,
  y_axis_log = FALSE,
  assay = NULL,
  selection.method = NULL,
  ...
)
Arguments
- seurat_object
Seurat object name.
- num_features
Number of top variable features to highlight by color/label.
- custom_features
A vector of custom feature names to label on plot instead of labeling top variable genes.
- label
logical. Whether to label the top features. Default is TRUE.
- pt.size
Adjust point size for plotting.
- colors_use
colors to use for plotting. Default is "black" and "red".
- repel
logical (default TRUE). Whether or not to repel the feature labels on plot.
- y_axis_log
logical. Whether to change y axis to log10 scale (Default is FALSE).
- assay
Assay to pull variable features from.
- selection.method
If more then one method use to calculate variable features specify which method to use for plotting. See
selection.methodparameter inVariableFeaturePlotfor list of options.- ...
Extra parameters passed to
VariableFeaturePlot.
Value
A ggplot object