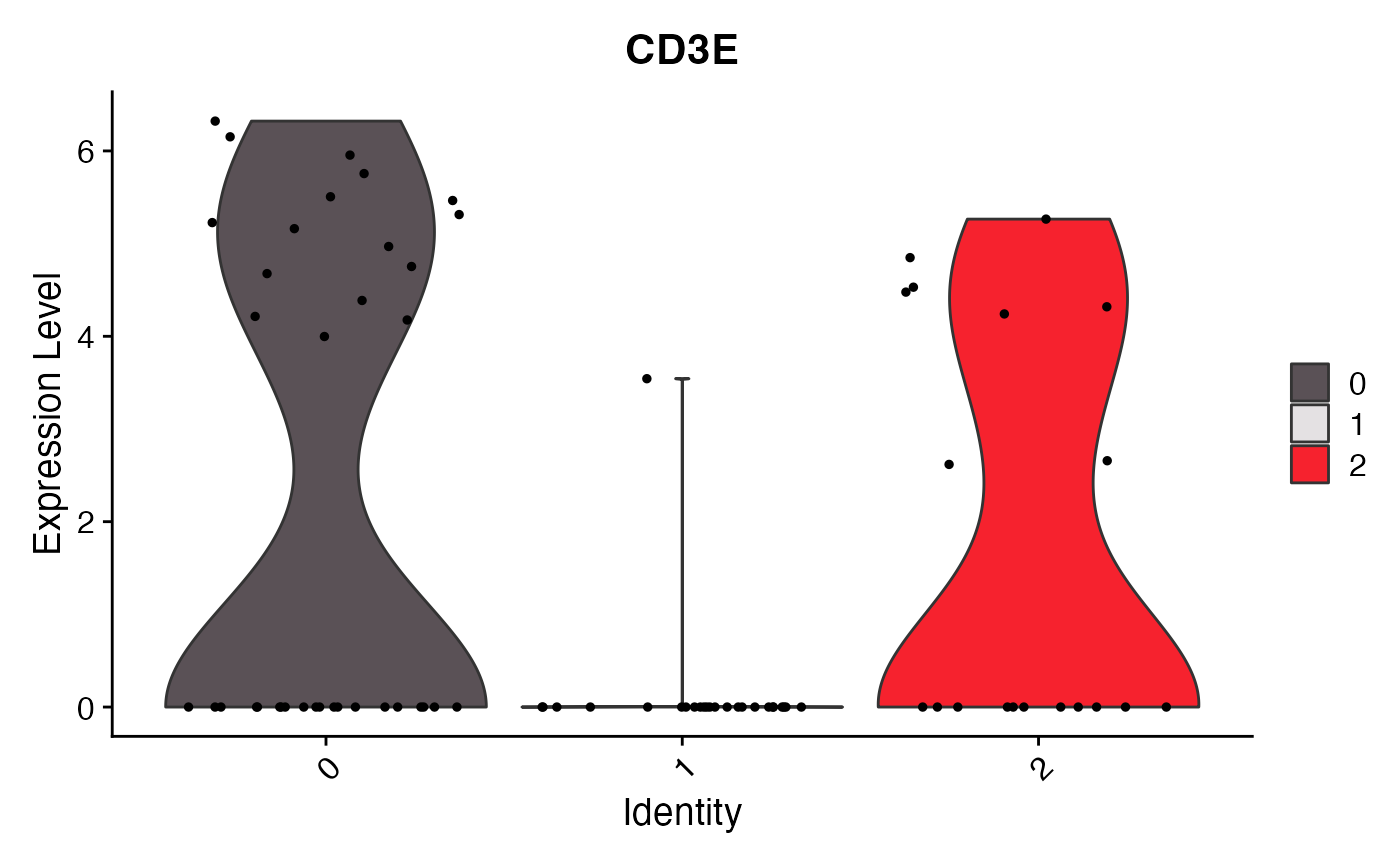
Creates DimPlot with some of the settings modified from their Seurat defaults (colors_use, shuffle, label).
VlnPlot_scCustom(
  seurat_object,
  features,
  colors_use = NULL,
  pt.size = NULL,
  group.by = NULL,
  split.by = NULL,
  plot_median = FALSE,
  plot_boxplot = FALSE,
  median_size = 15,
  idents = NULL,
  num_columns = NULL,
  raster = NULL,
  add.noise = TRUE,
  ggplot_default_colors = FALSE,
  color_seed = 123,
  ...
)
Arguments
- seurat_object
Seurat object name.
- features
Feature(s) to plot.
- colors_use
color palette to use for plotting. By default if number of levels plotted is less than or equal to 36 it will use "polychrome" and if greater than 36 will use "varibow" with shuffle = TRUE both from
DiscretePalette_scCustomize.- pt.size
Adjust point size for plotting.
- group.by
Name of one or more metadata columns to group (color) cells by (for example, orig.ident); default is the current active.ident of the object.
- split.by
Feature to split plots by (i.e. "orig.ident").
- plot_median
logical, whether to plot median for each ident on the plot (Default is FALSE).
- plot_boxplot
logical, whether to plot boxplot inside of violin (Default is FALSE).
- median_size
Shape size for the median is plotted.
- idents
Which classes to include in the plot (default is all).
- num_columns
Number of columns in plot layout. Only valid if
split.by != NULL.- raster
Convert points to raster format. Default is NULL which will rasterize by default if greater than 200,000 total points plotted (# Cells x # of features).
- add.noise
logical, determine if adding a small noise for plotting (Default is TRUE).
- ggplot_default_colors
logical. If
colors_use = NULL, Whether or not to return plot using default ggplot2 "hue" palette instead of default "polychrome" or "varibow" palettes.- color_seed
random seed for the "varibow" palette shuffle if
colors_use = NULLand number of groups plotted is greater than 36. Default = 123.- ...
Extra parameters passed to
VlnPlot.
Value
A ggplot object
References
Many of the param names and descriptions are from Seurat to facilitate ease of use as this is simply a wrapper to alter some of the default parameters https://github.com/satijalab/seurat/blob/master/R/visualization.R (License: GPL-3).
