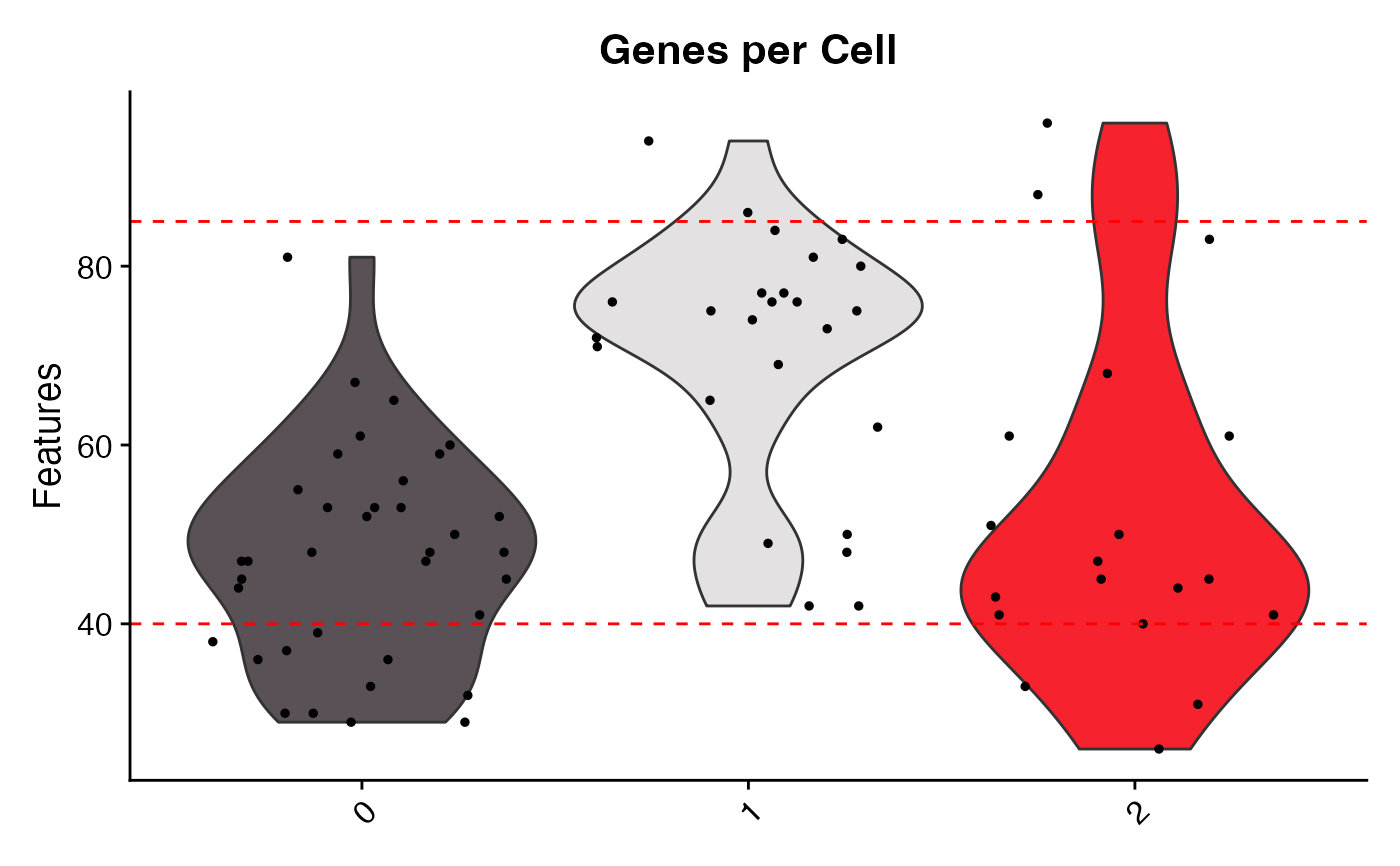
Custom VlnPlot for initial QC checks including lines for thresholding
QC_Plots_Genes(
  seurat_object,
  plot_title = "Genes Per Cell/Nucleus",
  group.by = NULL,
  x_axis_label = NULL,
  y_axis_label = "Features",
  low_cutoff = NULL,
  high_cutoff = NULL,
  cutoff_line_width = NULL,
  pt.size = NULL,
  plot_median = FALSE,
  plot_boxplot = FALSE,
  median_size = 15,
  colors_use = NULL,
  x_lab_rotate = TRUE,
  y_axis_log = FALSE,
  raster = NULL,
  assay = NULL,
  ggplot_default_colors = FALSE,
  color_seed = 123,
  ...
)
Arguments
- seurat_object
Seurat object name.
- plot_title
Plot Title.
- group.by
Name of one or more metadata columns to group (color) cells by (for example, orig.ident); default is the current active.ident of the object.
- x_axis_label
Label for x axis.
- y_axis_label
Label for y axis.
- low_cutoff
Plot line a potential low threshold for filtering.
- high_cutoff
Plot line a potential high threshold for filtering.
- cutoff_line_width
numerical value for thickness of cutoff lines, default is NULL.
- pt.size
Point size for plotting.
- plot_median
logical, whether to plot median for each ident on the plot (Default is FALSE).
- plot_boxplot
logical, whether to plot boxplot inside of violin (Default is FALSE).
- median_size
Shape size for the median is plotted.
- colors_use
vector of colors to use for plot.
- x_lab_rotate
Rotate x-axis labels 45 degrees (Default is TRUE).
- y_axis_log
logical. Whether to change y axis to log10 scale (Default is FALSE).
- raster
Convert points to raster format. Default is NULL which will rasterize by default if greater than 100,000 total points plotted (# Cells x # of features).
- assay
Name of assay to use, defaults to the active assay.
- ggplot_default_colors
logical. If
colors_use = NULL, Whether or not to return plot using default ggplot2 "hue" palette instead of default "polychrome" or "varibow" palettes.- color_seed
random seed for the "varibow" palette shuffle if
colors_use = NULLand number of groups plotted is greater than 36. Default = 123.- ...
Extra parameters passed to
VlnPlot.
Value
A ggplot object
